

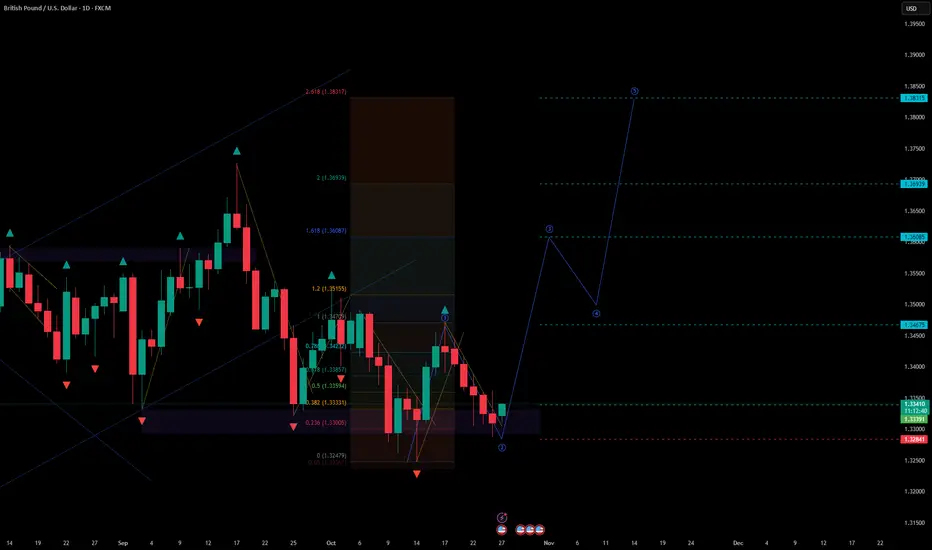
#GBPUSD (1D) – Potential Wave 3 Formation
Current price: 1.3337
The British pound is showing early signs of a potential third wave expansion after testing key support. Market structure suggests the pair may be transitioning from a corrective phase into a new impulsive leg higher.
🧩 Technical Overview
• The pair found strong support near 1.3300–1.3240, aligning with the lower boundary of the current structure and the 0.236 Fibonacci zone.
• Price action shows stabilization and a potential pivot from the support base.
• A breakout from the short-term downward channel would confirm the start of a bullish impulse.
📈 Scenario
• The structure indicates possible wave development toward higher Fibonacci targets.
• Stop-loss: below 1.3280, under the recent low.
• Upside targets:
– 1.3450–1.3470 — initial resistance / short-term confirmation zone
– 1.3600–1.3610 — mid-cycle resistance (1.618 Fib extension)
– 1.3690–1.3700 — secondary target
– 1.3810–1.3830 — extended objective (2.618 Fib projection)
• Break and daily close above 1.3450 would confirm the upward continuation pattern.
⚙️ Market Context
• GBP/USD remains in a corrective structure since September, but momentum indicators suggest exhaustion of the bearish leg.
• Fundamental backdrop: GBP stabilizing as USD momentum eases after recent highs.
• The structure aligns with broader risk-on sentiment and early signs of FX rotation into higher-yield currencies.
🧭 Summary
GBP/USD is consolidating near major support, potentially forming the base of a third wave.
As long as the price stays above 1.3280, bias remains bullish, targeting 1.3450 → 1.3600 → 1.3700 → 1.3810.
A daily breakout above 1.3450 would confirm the start of the impulsive phase.
Current price: 1.3337
The British pound is showing early signs of a potential third wave expansion after testing key support. Market structure suggests the pair may be transitioning from a corrective phase into a new impulsive leg higher.
🧩 Technical Overview
• The pair found strong support near 1.3300–1.3240, aligning with the lower boundary of the current structure and the 0.236 Fibonacci zone.
• Price action shows stabilization and a potential pivot from the support base.
• A breakout from the short-term downward channel would confirm the start of a bullish impulse.
📈 Scenario
• The structure indicates possible wave development toward higher Fibonacci targets.
• Stop-loss: below 1.3280, under the recent low.
• Upside targets:
– 1.3450–1.3470 — initial resistance / short-term confirmation zone
– 1.3600–1.3610 — mid-cycle resistance (1.618 Fib extension)
– 1.3690–1.3700 — secondary target
– 1.3810–1.3830 — extended objective (2.618 Fib projection)
• Break and daily close above 1.3450 would confirm the upward continuation pattern.
⚙️ Market Context
• GBP/USD remains in a corrective structure since September, but momentum indicators suggest exhaustion of the bearish leg.
• Fundamental backdrop: GBP stabilizing as USD momentum eases after recent highs.
• The structure aligns with broader risk-on sentiment and early signs of FX rotation into higher-yield currencies.
🧭 Summary
GBP/USD is consolidating near major support, potentially forming the base of a third wave.
As long as the price stays above 1.3280, bias remains bullish, targeting 1.3450 → 1.3600 → 1.3700 → 1.3810.
A daily breakout above 1.3450 would confirm the start of the impulsive phase.

Declinazione di responsabilità
Le informazioni e le pubblicazioni non sono intese come, e non costituiscono, consulenza o raccomandazioni finanziarie, di investimento, di trading o di altro tipo fornite o approvate da TradingView. Per ulteriori informazioni, consultare i Termini di utilizzo.
Declinazione di responsabilità
Le informazioni e le pubblicazioni non sono intese come, e non costituiscono, consulenza o raccomandazioni finanziarie, di investimento, di trading o di altro tipo fornite o approvate da TradingView. Per ulteriori informazioni, consultare i Termini di utilizzo.