

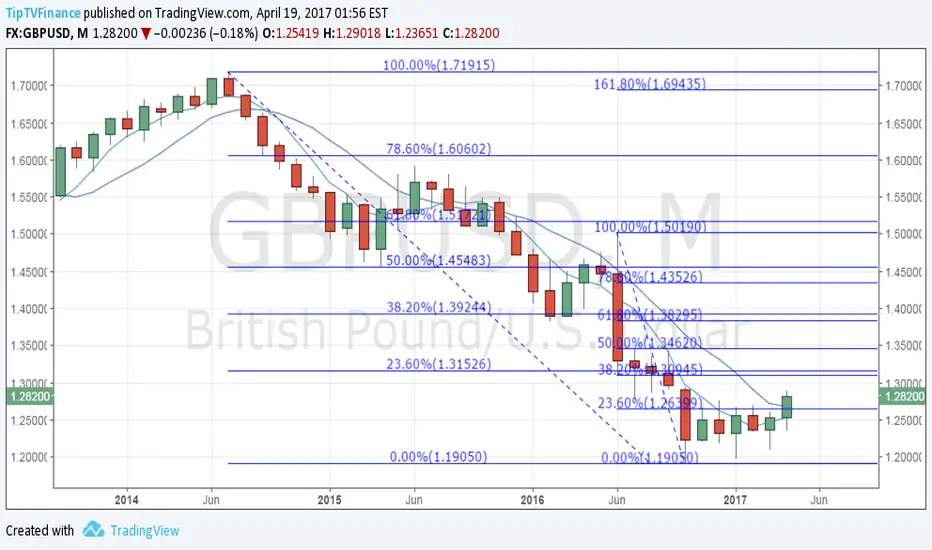
The higher low formation since bottoming out in October 2016 followed by a sharp rise above 1.2774 (Dec high), coupled with the breach of the downtrend on the monthly RSI suggests the rally could be extended to a stiff resistance around 1.3094 (38.2% of 1.5019-1.1905) and 1.3152 (23.6% of 1.71915-1.1905). The 5-MA on the monthly chart has bottomed out as well.
Only a weekly close below 1.2640 would suggest bullish invalidation.
Only a weekly close below 1.2640 would suggest bullish invalidation.

Declinazione di responsabilità
Le informazioni e le pubblicazioni non sono intese come, e non costituiscono, consulenza o raccomandazioni finanziarie, di investimento, di trading o di altro tipo fornite o approvate da TradingView. Per ulteriori informazioni, consultare i Termini di utilizzo.
Declinazione di responsabilità
Le informazioni e le pubblicazioni non sono intese come, e non costituiscono, consulenza o raccomandazioni finanziarie, di investimento, di trading o di altro tipo fornite o approvate da TradingView. Per ulteriori informazioni, consultare i Termini di utilizzo.