
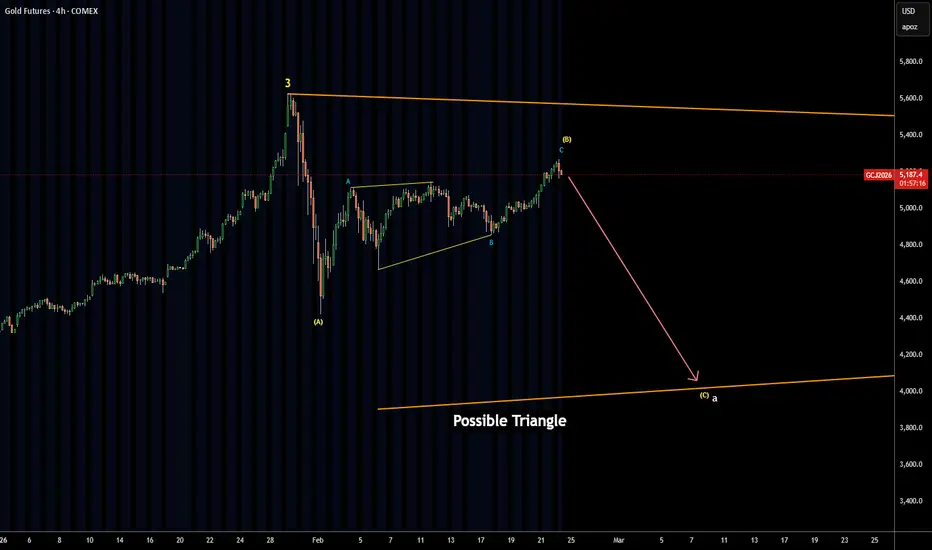
switched to 4-hour chart to show what's under the hood
of possible Triangle pattern
the first large wave A down (white) consists of three yellow waves ABC
yellow A was sharp and it's over
yellow B has three blue ABC subwaves
we got blue A and B definitely completed, wave C might be over
as it already surpassed the peak of blue A and is almost 61.8% of its size
next, yellow C is expected to follow to the downside
it might hit at least the bottom of wave A at $4,430 and dive
lower to $4,100
of possible Triangle pattern
the first large wave A down (white) consists of three yellow waves ABC
yellow A was sharp and it's over
yellow B has three blue ABC subwaves
we got blue A and B definitely completed, wave C might be over
as it already surpassed the peak of blue A and is almost 61.8% of its size
next, yellow C is expected to follow to the downside
it might hit at least the bottom of wave A at $4,430 and dive
lower to $4,100

Pubblicazioni correlate
Declinazione di responsabilità
Le informazioni e le pubblicazioni non sono intese come, e non costituiscono, consulenza o raccomandazioni finanziarie, di investimento, di trading o di altro tipo fornite o approvate da TradingView. Per ulteriori informazioni, consultare i Termini di utilizzo.
Pubblicazioni correlate
Declinazione di responsabilità
Le informazioni e le pubblicazioni non sono intese come, e non costituiscono, consulenza o raccomandazioni finanziarie, di investimento, di trading o di altro tipo fornite o approvate da TradingView. Per ulteriori informazioni, consultare i Termini di utilizzo.