
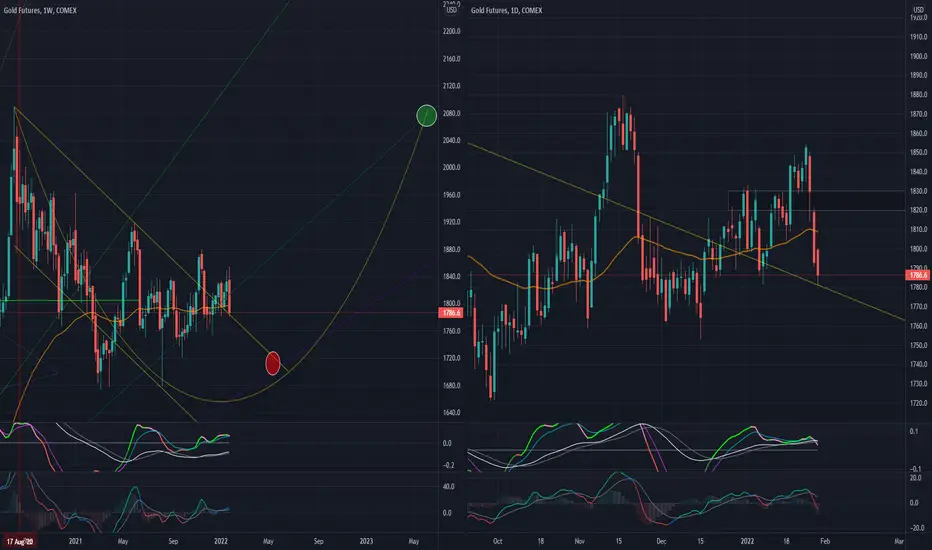
Ever since August 2020, Gold has been acting odd. It has been ranging in a rather large range, and somewhat random IMHO.
The week ended strongly down with an engulfing candlestick that covered a six week range, ending at the lower end of the range with a lower low. This is a rather bearish indication IMHO.
The daily chart showed this near term bearish with a gap down and long bearish candles.
Oddly... appears that the adjusted downside target is 1700-1720; with a longer term upside back to 2000.
Just be wary... I am.
The week ended strongly down with an engulfing candlestick that covered a six week range, ending at the lower end of the range with a lower low. This is a rather bearish indication IMHO.
The daily chart showed this near term bearish with a gap down and long bearish candles.
Oddly... appears that the adjusted downside target is 1700-1720; with a longer term upside back to 2000.
Just be wary... I am.

Pubblicazioni correlate
Declinazione di responsabilità
Le informazioni e le pubblicazioni non sono intese come, e non costituiscono, consulenza o raccomandazioni finanziarie, di investimento, di trading o di altro tipo fornite o approvate da TradingView. Per ulteriori informazioni, consultare i Termini di utilizzo.
Pubblicazioni correlate
Declinazione di responsabilità
Le informazioni e le pubblicazioni non sono intese come, e non costituiscono, consulenza o raccomandazioni finanziarie, di investimento, di trading o di altro tipo fornite o approvate da TradingView. Per ulteriori informazioni, consultare i Termini di utilizzo.