
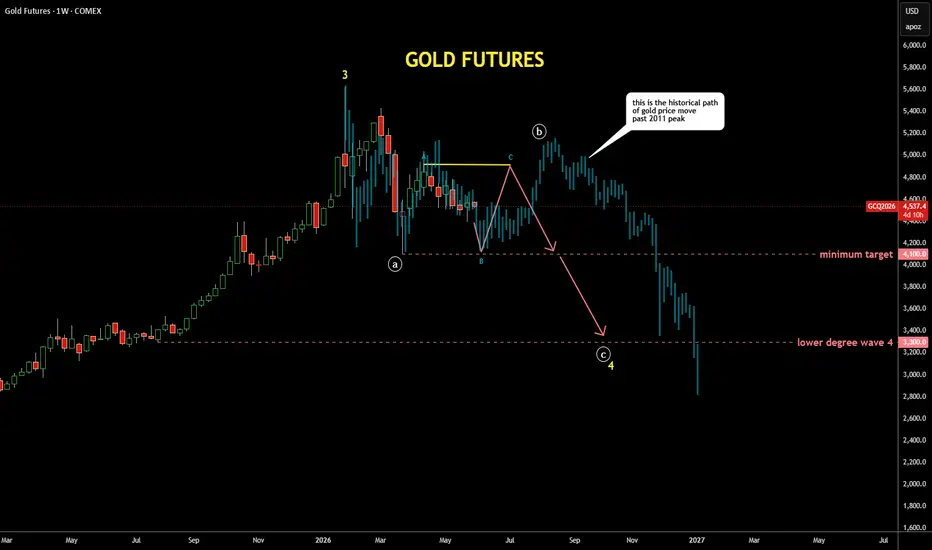
It's quite interesting exercise to check past patterns
if it is applicable to the current price structure
I scrolled back to distant 2011 where the gold peaked around $1,900,
copied the structure from there and pasted to the current peak
I fitted the bar pattern (faded blue bars) with tops and bottoms
It looks similar to the current structure as extremes align almost perfectly
It also matches with the map I posted earlier last week with bit more volatility
if it is applicable to the current price structure
I scrolled back to distant 2011 where the gold peaked around $1,900,
copied the structure from there and pasted to the current peak
I fitted the bar pattern (faded blue bars) with tops and bottoms
It looks similar to the current structure as extremes align almost perfectly
It also matches with the map I posted earlier last week with bit more volatility

Pubblicazioni correlate
Declinazione di responsabilità
Le informazioni e le pubblicazioni non sono intese come, e non costituiscono, consulenza o raccomandazioni finanziarie, di investimento, di trading o di altro tipo fornite o approvate da TradingView. Per ulteriori informazioni, consultare i Termini di utilizzo.
Pubblicazioni correlate
Declinazione di responsabilità
Le informazioni e le pubblicazioni non sono intese come, e non costituiscono, consulenza o raccomandazioni finanziarie, di investimento, di trading o di altro tipo fornite o approvate da TradingView. Per ulteriori informazioni, consultare i Termini di utilizzo.