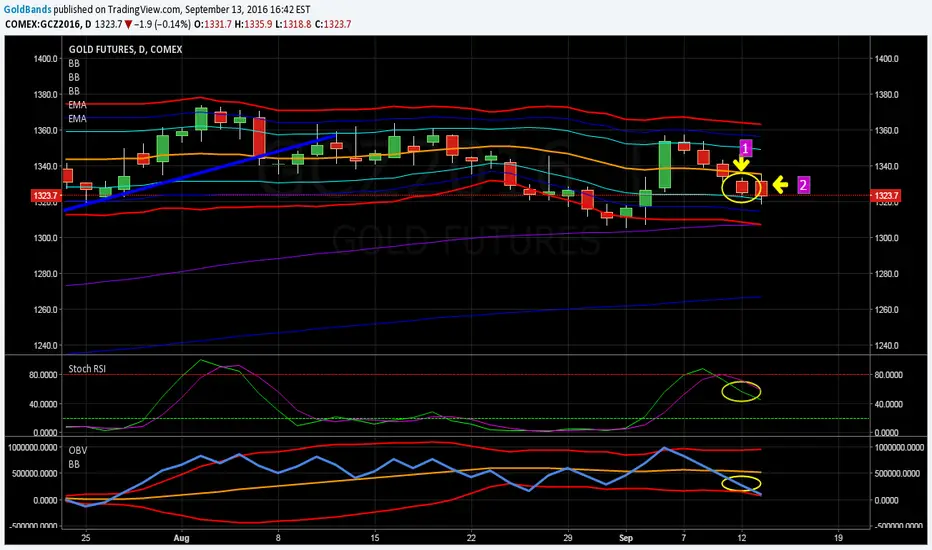
Yesterday, 9/12, saw continued downward movement in  Gold futures. While that was good for my short position (in at 1341.8), I was concerned because of the gap up at the close of day (#1). But here is why I stayed short and didn't close my position (reference the yellow circles on the Stoch RSI and OBV).
1. Stoch RSI is is an obvious downtrend.
2. OBV continued lower and was still above the lower Bollinger Band.
This confirmed that there is still downward movement in the current cycle. The combination of these 2 indicators kept me in the trade. I will be watching closely to see how the OBV reacts at the lower BB and see if we get more follow through to the downside.
Gold futures. While that was good for my short position (in at 1341.8), I was concerned because of the gap up at the close of day (#1). But here is why I stayed short and didn't close my position (reference the yellow circles on the Stoch RSI and OBV).1. Stoch RSI is is an obvious downtrend.
2. OBV continued lower and was still above the lower Bollinger Band.
This confirmed that there is still downward movement in the current cycle. The combination of these 2 indicators kept me in the trade. I will be watching closely to see how the OBV reacts at the lower BB and see if we get more follow through to the downside.
Trade attivo
GOLD
Pubblicazioni correlate
Declinazione di responsabilità
Le informazioni e le pubblicazioni non sono intese come, e non costituiscono, consulenza o raccomandazioni finanziarie, di investimento, di trading o di altro tipo fornite o approvate da TradingView. Per ulteriori informazioni, consultare i Termini di utilizzo.
Pubblicazioni correlate
Declinazione di responsabilità
Le informazioni e le pubblicazioni non sono intese come, e non costituiscono, consulenza o raccomandazioni finanziarie, di investimento, di trading o di altro tipo fornite o approvate da TradingView. Per ulteriori informazioni, consultare i Termini di utilizzo.