
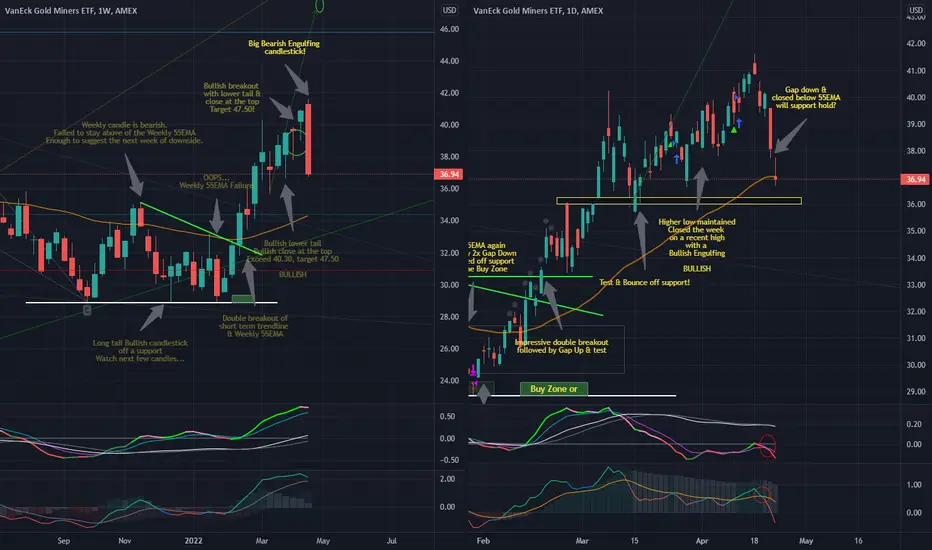
In the last week, GDX erased the bullishness of the preceding month with one fell swoop of an Bearish Engulfing kind (weekly chart).
So expecting continued bearish candles would be expected as it follows through.
The daily chart supports that view so far, and it just broke down of the 55EMA, after a gap down. The good thing is that it did not really gap and run... at least not yet.
Technicals are overall bearish, at least for a bit. Expecting bounces off 36, maybe even 35.
So expecting continued bearish candles would be expected as it follows through.
The daily chart supports that view so far, and it just broke down of the 55EMA, after a gap down. The good thing is that it did not really gap and run... at least not yet.
Technicals are overall bearish, at least for a bit. Expecting bounces off 36, maybe even 35.

Pubblicazioni correlate
Declinazione di responsabilità
Le informazioni e le pubblicazioni non sono intese come, e non costituiscono, consulenza o raccomandazioni finanziarie, di investimento, di trading o di altro tipo fornite o approvate da TradingView. Per ulteriori informazioni, consultare i Termini di utilizzo.
Pubblicazioni correlate
Declinazione di responsabilità
Le informazioni e le pubblicazioni non sono intese come, e non costituiscono, consulenza o raccomandazioni finanziarie, di investimento, di trading o di altro tipo fornite o approvate da TradingView. Per ulteriori informazioni, consultare i Termini di utilizzo.