
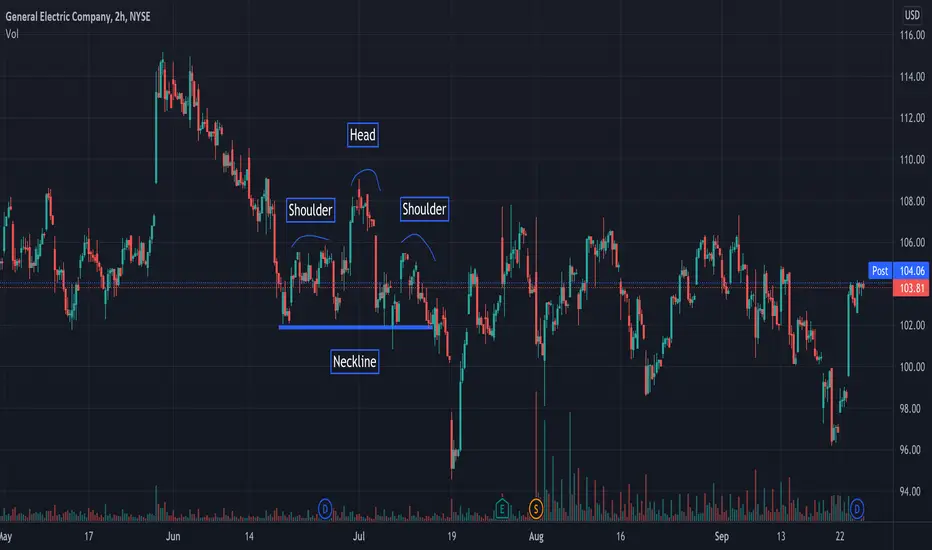
General Electric formed a Head and Shoulders pattern starting on June 17, 2021, and ended on July 15, 2021. This pattern was soon followed by a breakdown. Since then, the stock has been operating in a horizontal channel with resistance at $107 and $98. Look to enter the market around the lower resistance mark.

Declinazione di responsabilità
Le informazioni e le pubblicazioni non sono intese come, e non costituiscono, consulenza o raccomandazioni finanziarie, di investimento, di trading o di altro tipo fornite o approvate da TradingView. Per ulteriori informazioni, consultare i Termini di utilizzo.
Declinazione di responsabilità
Le informazioni e le pubblicazioni non sono intese come, e non costituiscono, consulenza o raccomandazioni finanziarie, di investimento, di trading o di altro tipo fornite o approvate da TradingView. Per ulteriori informazioni, consultare i Termini di utilizzo.