Long
$GLCH long term view
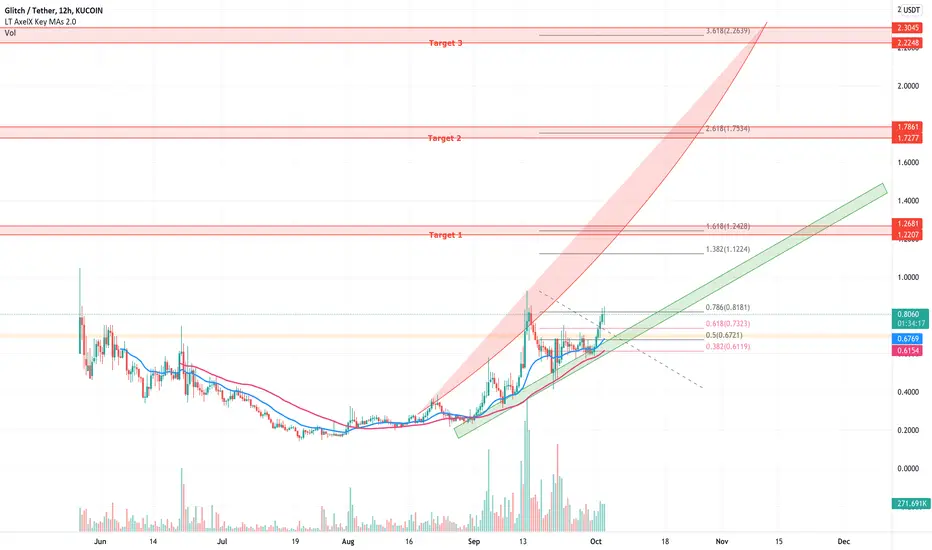
In this chart I show my expectations for $GLCH based on fib level and oversold/ overbought zones.
Red curve = overbought, we see a retranchement every time we get into this zone.
Green curve = accumulation, we get a pump every time we reach this zone.
First target around $1.25.
Target 2: $1.75
Target 3: $2.25
This chart will be updated once we go further in the cycle.
Red curve = overbought, we see a retranchement every time we get into this zone.
Green curve = accumulation, we get a pump every time we reach this zone.
First target around $1.25.
Target 2: $1.75
Target 3: $2.25
This chart will be updated once we go further in the cycle.

Declinazione di responsabilità
Le informazioni e le pubblicazioni non sono intese come, e non costituiscono, consulenza o raccomandazioni finanziarie, di investimento, di trading o di altro tipo fornite o approvate da TradingView. Per ulteriori informazioni, consultare i Termini di utilizzo.
Declinazione di responsabilità
Le informazioni e le pubblicazioni non sono intese come, e non costituiscono, consulenza o raccomandazioni finanziarie, di investimento, di trading o di altro tipo fornite o approvate da TradingView. Per ulteriori informazioni, consultare i Termini di utilizzo.