$GLCH projection based on the LOG chart
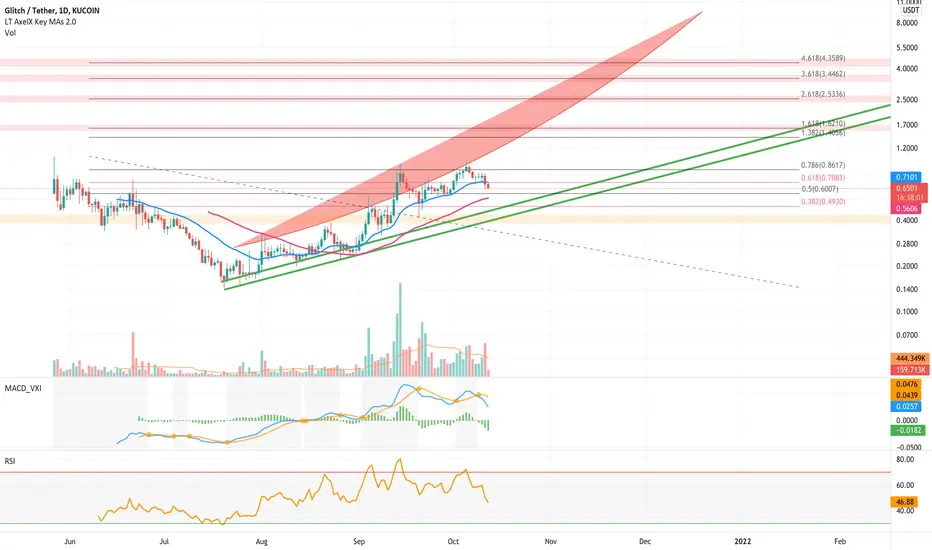
My previous model on GGCH is broken, this model only looked at linear data. Since most of the moves in crypto are exponential most of the times. It could be better to take the LOG chart in consideration...
In this chart potential upside and downside is greater.
The support band of the LOG chart shows a potential bottom between $0.47 - $0.40.
In this chart potential upside and downside is greater.
The support band of the LOG chart shows a potential bottom between $0.47 - $0.40.

Declinazione di responsabilità
Le informazioni e le pubblicazioni non sono intese come, e non costituiscono, consulenza o raccomandazioni finanziarie, di investimento, di trading o di altro tipo fornite o approvate da TradingView. Per ulteriori informazioni, consultare i Termini di utilizzo.
Declinazione di responsabilità
Le informazioni e le pubblicazioni non sono intese come, e non costituiscono, consulenza o raccomandazioni finanziarie, di investimento, di trading o di altro tipo fornite o approvate da TradingView. Per ulteriori informazioni, consultare i Termini di utilizzo.