
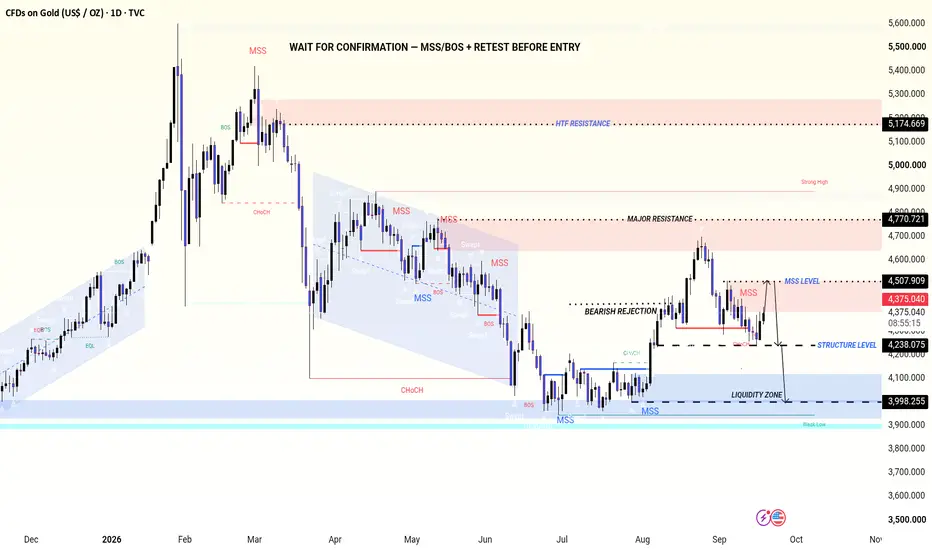
XAUUSD 1D — Market Structure, Liquidity & Supply/Demand Analysis
Gold is currently trading around 4,373, with the daily chart showing a clear sequence of structural shifts after the previous major decline. The analysis is based on MSS, BOS, liquidity sweeps, supply/demand zones and key support/resistance levels marked on the chart.
1. Previous Bullish Expansion
The left side of the chart shows a strong bullish phase where price continued forming higher highs and higher lows. Multiple BOS formations confirmed that buyers were maintaining control.
The strong impulsive candles indicate aggressive buying pressure rather than simple sideways movement. Each pullback was followed by another bullish expansion, keeping the structure intact.
2. Major High & Liquidity
Price eventually pushed toward the 5,400+ area, creating a major swing high. After reaching this region, bullish momentum weakened and price started producing rejection candles.
The subsequent MSS/CHoCH indicated a change in short-term structure and opened the way for a deeper correction.
3. Bearish Expansion
After the structural shift, several strong bearish candles appeared. These candles broke previous swing lows and produced multiple BOS signals.
The reason behind this phase was the failure to maintain the previous bullish structure, followed by continued selling pressure and liquidity being taken from lower levels.
4. Consolidation & Liquidity Sweeps
Around the 4,500–4,800 region, price spent considerable time moving sideways. The repeated wicks around previous highs/lows suggest liquidity was being tested on both sides.
This type of price action should not automatically be treated as a buy or sell signal. Confirmation from structure is important before interpreting the next directional move.
5. Major Demand Reaction
Price eventually moved toward the 4,000 area, where the chart marks a major demand zone.
The reaction from this zone produced a series of bullish candles and a subsequent MSS, suggesting that selling momentum was losing strength and buyers were becoming active around the marked demand.
6. August Bullish Recovery
From the demand area, Gold started creating higher lows and higher highs. The bullish candles became more consistent, eventually producing a BOS and confirming a recovery in the short-term structure.
This move continued toward the 4,500+ region, where price again encountered resistance.
7. Current Structure
The latest price action shows rejection from the 4,500–4,770 supply/resistance area. The recent candles are trading below the marked 4,507.909 level, while 4,236.998 is acting as an important structure/support level.
The current area can therefore be treated as a decision zone rather than assuming an immediate continuation.
Key Levels
4,507.909 → Key resistance / MSS area
4,236.998 → Key support / structure level
3,998.255 → Major demand / downside liquidity area
4,770.721 → Major resistance / strong-high area
5,174.669 → Higher-timeframe supply/resistance
Bullish Scenario
If price holds above 4,236.998 and produces a confirmed bullish MSS/BOS, followed by a successful retest, the recovery structure could remain valid toward the higher resistance levels.
Bearish Scenario
If price fails to hold 4,236.998 and confirms a bearish structural break, attention can shift toward the 3,998.255 demand zone.
Risk Management
This is a technical market-structure analysis, not a guaranteed signal. Avoid entering simply because price reaches a marked zone. Wait for confirmation + retest, define your invalidation level before entry, and manage position size according to your own risk plan.
Educational note: Every candle does not have one independently provable “reason”; the candle-by-candle interpretation above is based on its position within the visible structure, liquidity and supply/demand context.
Gold is currently trading around 4,373, with the daily chart showing a clear sequence of structural shifts after the previous major decline. The analysis is based on MSS, BOS, liquidity sweeps, supply/demand zones and key support/resistance levels marked on the chart.
1. Previous Bullish Expansion
The left side of the chart shows a strong bullish phase where price continued forming higher highs and higher lows. Multiple BOS formations confirmed that buyers were maintaining control.
The strong impulsive candles indicate aggressive buying pressure rather than simple sideways movement. Each pullback was followed by another bullish expansion, keeping the structure intact.
2. Major High & Liquidity
Price eventually pushed toward the 5,400+ area, creating a major swing high. After reaching this region, bullish momentum weakened and price started producing rejection candles.
The subsequent MSS/CHoCH indicated a change in short-term structure and opened the way for a deeper correction.
3. Bearish Expansion
After the structural shift, several strong bearish candles appeared. These candles broke previous swing lows and produced multiple BOS signals.
The reason behind this phase was the failure to maintain the previous bullish structure, followed by continued selling pressure and liquidity being taken from lower levels.
4. Consolidation & Liquidity Sweeps
Around the 4,500–4,800 region, price spent considerable time moving sideways. The repeated wicks around previous highs/lows suggest liquidity was being tested on both sides.
This type of price action should not automatically be treated as a buy or sell signal. Confirmation from structure is important before interpreting the next directional move.
5. Major Demand Reaction
Price eventually moved toward the 4,000 area, where the chart marks a major demand zone.
The reaction from this zone produced a series of bullish candles and a subsequent MSS, suggesting that selling momentum was losing strength and buyers were becoming active around the marked demand.
6. August Bullish Recovery
From the demand area, Gold started creating higher lows and higher highs. The bullish candles became more consistent, eventually producing a BOS and confirming a recovery in the short-term structure.
This move continued toward the 4,500+ region, where price again encountered resistance.
7. Current Structure
The latest price action shows rejection from the 4,500–4,770 supply/resistance area. The recent candles are trading below the marked 4,507.909 level, while 4,236.998 is acting as an important structure/support level.
The current area can therefore be treated as a decision zone rather than assuming an immediate continuation.
Key Levels
4,507.909 → Key resistance / MSS area
4,236.998 → Key support / structure level
3,998.255 → Major demand / downside liquidity area
4,770.721 → Major resistance / strong-high area
5,174.669 → Higher-timeframe supply/resistance
Bullish Scenario
If price holds above 4,236.998 and produces a confirmed bullish MSS/BOS, followed by a successful retest, the recovery structure could remain valid toward the higher resistance levels.
Bearish Scenario
If price fails to hold 4,236.998 and confirms a bearish structural break, attention can shift toward the 3,998.255 demand zone.
Risk Management
This is a technical market-structure analysis, not a guaranteed signal. Avoid entering simply because price reaches a marked zone. Wait for confirmation + retest, define your invalidation level before entry, and manage position size according to your own risk plan.
Educational note: Every candle does not have one independently provable “reason”; the candle-by-candle interpretation above is based on its position within the visible structure, liquidity and supply/demand context.
Trade attivo
1000 pips running profit when market will open then hold on my last target 
MY DAILY SIGNAL CHANNEL free
t.me/+tjz4xzC4QUY2NmZk
Vip Premium group for free
t.me/+tjz4xzC4QUY2NmZk
t.me/+tjz4xzC4QUY2NmZk
Vip Premium group for free
t.me/+tjz4xzC4QUY2NmZk
Pubblicazioni correlate
Declinazione di responsabilità
Le informazioni e le pubblicazioni non sono intese come, e non costituiscono, consulenza o raccomandazioni finanziarie, di investimento, di trading o di altro tipo fornite o approvate da TradingView. Per ulteriori informazioni, consultare i Termini di utilizzo.
MY DAILY SIGNAL CHANNEL free
t.me/+tjz4xzC4QUY2NmZk
Vip Premium group for free
t.me/+tjz4xzC4QUY2NmZk
t.me/+tjz4xzC4QUY2NmZk
Vip Premium group for free
t.me/+tjz4xzC4QUY2NmZk
Pubblicazioni correlate
Declinazione di responsabilità
Le informazioni e le pubblicazioni non sono intese come, e non costituiscono, consulenza o raccomandazioni finanziarie, di investimento, di trading o di altro tipo fornite o approvate da TradingView. Per ulteriori informazioni, consultare i Termini di utilizzo.