
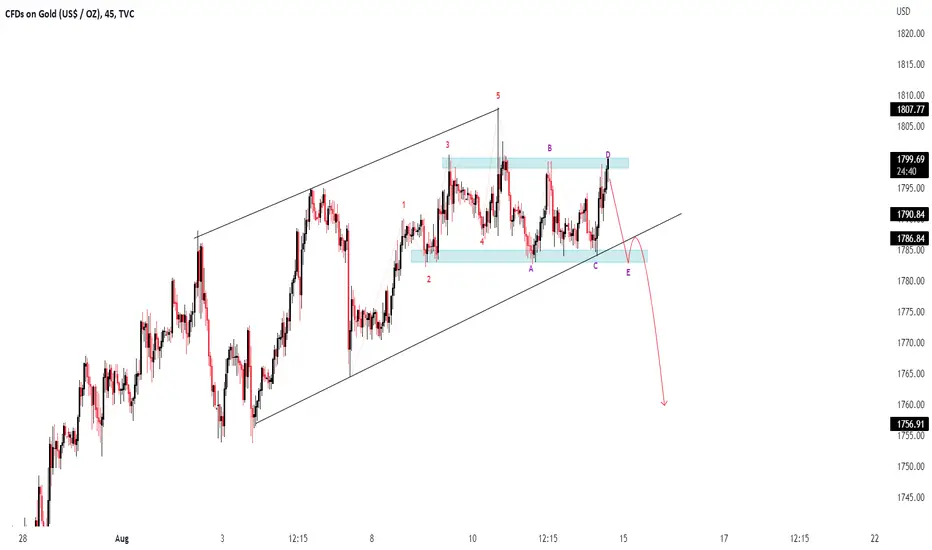
XAU/USD ( Gold / U.S Dollar ) Technical Analysis Chart Update
Time Frame - M45
According to the Pattern in Short Time Frame #STF ( #Bullish Channel ) it failed to Break the Strong Resistance Level #1798-9
According to Elliot waves it has completed the Impulsive #12345 waves and its now Following Corrective wave #ABCDE it will follow Sell Trend to complete its " E " wave
If it Breaks the Lower Trend Line #LTL and Retest it will follow More Sell

Declinazione di responsabilità
Le informazioni e le pubblicazioni non sono intese come, e non costituiscono, consulenza o raccomandazioni finanziarie, di investimento, di trading o di altro tipo fornite o approvate da TradingView. Per ulteriori informazioni, consultare i Termini di utilizzo.
Declinazione di responsabilità
Le informazioni e le pubblicazioni non sono intese come, e non costituiscono, consulenza o raccomandazioni finanziarie, di investimento, di trading o di altro tipo fornite o approvate da TradingView. Per ulteriori informazioni, consultare i Termini di utilizzo.