
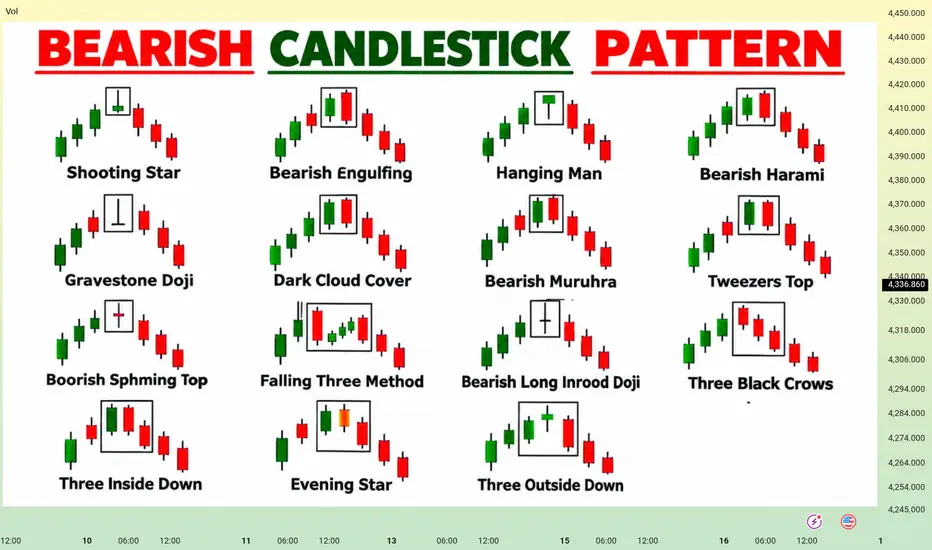
This chart presents a collection of commonly observed bearish candlestick patterns that can help traders study potential changes in short term market structure and selling pressure
The patterns shown include Shooting Star, Bearish Engulfing, Hanging Man, Bearish Harami, Gravestone Doji, Dark Cloud Cover, Bearish Marubozu, Tweezer Top, Bearish Spinning Top, Falling Three Methods, Bearish Long Legged Doji, Three Black Crows, Three Inside Down, Evening Star, and Three Outside Down
These formations should be understood as price action concepts rather than standalone trading signals A bearish candlestick pattern may indicate that buyers are losing momentum or that sellers are becoming more active, but the pattern itself does not guarantee a future price movement
Market Structure and Confirmation
The reliability of a bearish formation can depend heavily on the surrounding market structure Traders may compare the pattern with previous highs and lows, support and resistance levels, trend direction, volume where available, and the reaction of price after the formation is completed
For example, a bearish reversal pattern appearing near a significant resistance level may provide different information from the same pattern appearing in the middle of a strong bullish trend Context therefore remains important when studying candlestick behaviour
Confirmation can also be observed through subsequent price action A later candle closing below an important structure level may provide additional evidence that selling pressure is developing Conversely, if price quickly recovers and continues making higher highs, the bearish formation may lose significance
Important Candlestick Concepts
A Shooting Star can reflect rejection from higher prices after an upward move
A Bearish Engulfing formation shows a bearish candle covering the previous bullish candle and can indicate increasing selling pressure
A Hanging Man can appear after an advance and highlights a period where sellers were able to push price lower during the session
A Bearish Harami represents a smaller candle developing within the previous larger bullish candle and may indicate slowing momentum
A Gravestone Doji reflects strong rejection of higher prices and can become more meaningful when supported by surrounding market structure
Patterns such as Evening Star, Three Inside Down, Three Outside Down, and Three Black Crows involve multiple candles and can provide additional information about changing momentum and price behaviour
Risk Management
Candlestick analysis should always be combined with appropriate risk management No individual pattern can remove market uncertainty, and unexpected volatility can invalidate a technical setup at any time
Position sizing should be considered carefully according to individual risk tolerance Traders should avoid treating historical pattern behaviour as a guarantee of future results
This chart is presented for educational and technical analysis purposes only It is intended to help traders understand bearish candlestick formations, market structure, confirmation, and price action behaviour rather than provide a guaranteed trading outcome or direct investment instruction
The patterns shown include Shooting Star, Bearish Engulfing, Hanging Man, Bearish Harami, Gravestone Doji, Dark Cloud Cover, Bearish Marubozu, Tweezer Top, Bearish Spinning Top, Falling Three Methods, Bearish Long Legged Doji, Three Black Crows, Three Inside Down, Evening Star, and Three Outside Down
These formations should be understood as price action concepts rather than standalone trading signals A bearish candlestick pattern may indicate that buyers are losing momentum or that sellers are becoming more active, but the pattern itself does not guarantee a future price movement
Market Structure and Confirmation
The reliability of a bearish formation can depend heavily on the surrounding market structure Traders may compare the pattern with previous highs and lows, support and resistance levels, trend direction, volume where available, and the reaction of price after the formation is completed
For example, a bearish reversal pattern appearing near a significant resistance level may provide different information from the same pattern appearing in the middle of a strong bullish trend Context therefore remains important when studying candlestick behaviour
Confirmation can also be observed through subsequent price action A later candle closing below an important structure level may provide additional evidence that selling pressure is developing Conversely, if price quickly recovers and continues making higher highs, the bearish formation may lose significance
Important Candlestick Concepts
A Shooting Star can reflect rejection from higher prices after an upward move
A Bearish Engulfing formation shows a bearish candle covering the previous bullish candle and can indicate increasing selling pressure
A Hanging Man can appear after an advance and highlights a period where sellers were able to push price lower during the session
A Bearish Harami represents a smaller candle developing within the previous larger bullish candle and may indicate slowing momentum
A Gravestone Doji reflects strong rejection of higher prices and can become more meaningful when supported by surrounding market structure
Patterns such as Evening Star, Three Inside Down, Three Outside Down, and Three Black Crows involve multiple candles and can provide additional information about changing momentum and price behaviour
Risk Management
Candlestick analysis should always be combined with appropriate risk management No individual pattern can remove market uncertainty, and unexpected volatility can invalidate a technical setup at any time
Position sizing should be considered carefully according to individual risk tolerance Traders should avoid treating historical pattern behaviour as a guarantee of future results
This chart is presented for educational and technical analysis purposes only It is intended to help traders understand bearish candlestick formations, market structure, confirmation, and price action behaviour rather than provide a guaranteed trading outcome or direct investment instruction

join over telegram channel click the I con link
t.me/+-jXU2zorBIdiODk0
t.me/+-jXU2zorBIdiODk0
Pubblicazioni correlate
Declinazione di responsabilità
Le informazioni e le pubblicazioni non sono intese come, e non costituiscono, consulenza o raccomandazioni finanziarie, di investimento, di trading o di altro tipo fornite o approvate da TradingView. Per ulteriori informazioni, consultare i Termini di utilizzo.
join over telegram channel click the I con link
t.me/+-jXU2zorBIdiODk0
t.me/+-jXU2zorBIdiODk0
Pubblicazioni correlate
Declinazione di responsabilità
Le informazioni e le pubblicazioni non sono intese come, e non costituiscono, consulenza o raccomandazioni finanziarie, di investimento, di trading o di altro tipo fornite o approvate da TradingView. Per ulteriori informazioni, consultare i Termini di utilizzo.