
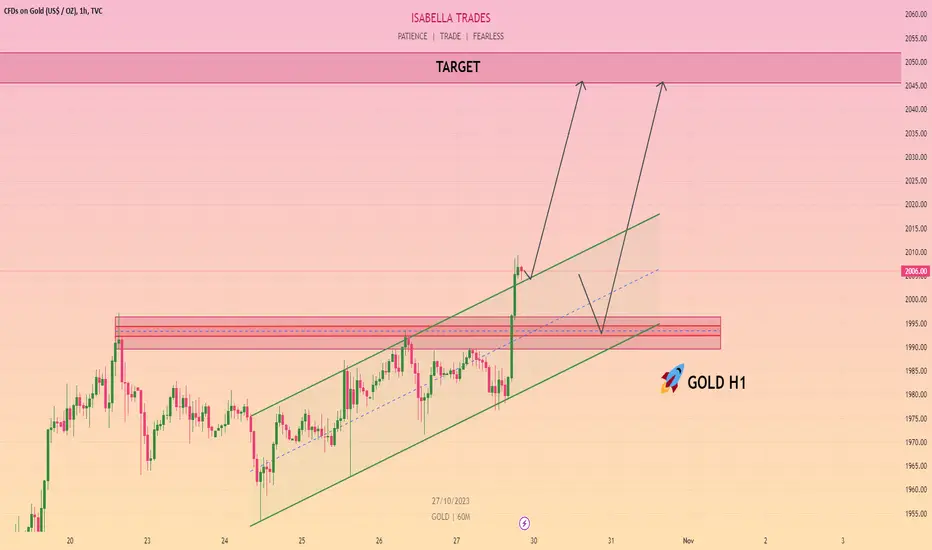
In the coming days, it's likely that the price of gold will reach a new high. We base this expectation on the fact that gold is currently touching a demand level on 1995-1997$ the H1 chart, a level often associated with price increases. Additionally, we've noticed an order block coinciding with a Fibonacci level, which adds weight to our prediction. Keep an eye on these factors as you consider your trading decisions.
Nota
XAUUSD : 1997-1995 Stoploss : 1990
Takeprofit : 2010
Nota
XAUUSD BUY LIMIT 🌹 1995-93TAKE PROFIT. 1999
TAKE PROFIT. 2002
TAKE PROFIT. 2009
STOP LOSS. 1989
Nota
XAUUSD SELL 🌹 1986-1988TAKE PROFIT. 1982
TAKE PROFIT. 1978
TAKE PROFIT. 1975
STOP LOSS. 1989
Nota
XAUUSD BUY 🌹 1984-1982TAKE PROFIT. 1987
TAKE PROFIT. 1990
TAKE PROFIT. 1996
STOP LOSS. 1978

Declinazione di responsabilità
Le informazioni e le pubblicazioni non sono intese come, e non costituiscono, consulenza o raccomandazioni finanziarie, di investimento, di trading o di altro tipo fornite o approvate da TradingView. Per ulteriori informazioni, consultare i Termini di utilizzo.
Declinazione di responsabilità
Le informazioni e le pubblicazioni non sono intese come, e non costituiscono, consulenza o raccomandazioni finanziarie, di investimento, di trading o di altro tipo fornite o approvate da TradingView. Per ulteriori informazioni, consultare i Termini di utilizzo.