
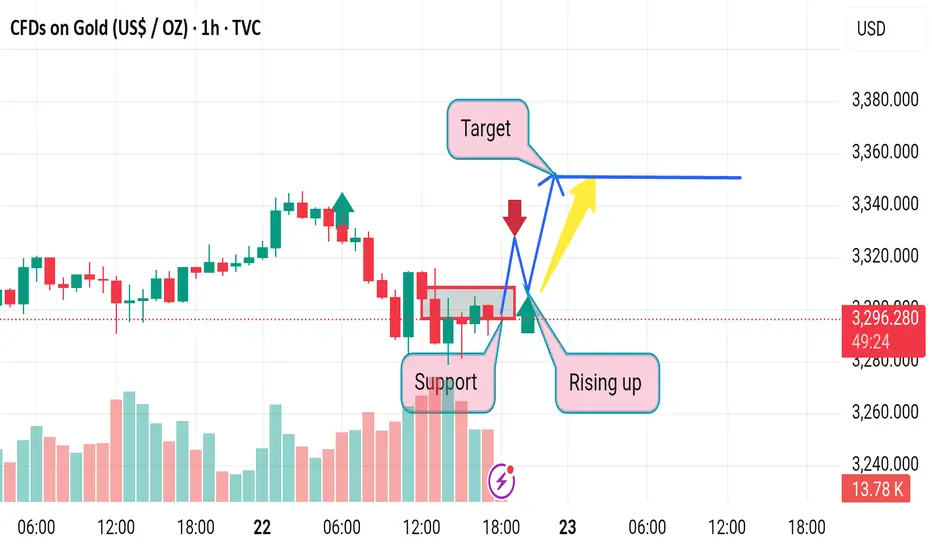
1. Assumption of Support
Observation: The "Support" zone is marked around the 3,285–3,290 level.
Disruption: This area has only a few touches and lacks clear validation. Support should be confirmed with multiple bounces and strong volume reactions. Here, volume is present but inconclusive.
2. Overly Optimistic Target
Observation: The target area is set around 3,350, which assumes a clean breakout.
Disruption: This ignores potential resistance levels between 3,310–3,330 that could act as hurdles. The price might stall or reverse before reaching that far.
3. Breakout Path Assumptions
Observation: The blue arrows suggest a bullish breakout, possibly after a retest.
Disruption: There's a strong red rejection candle marked by a red arrow—suggesting bearish momentum. Without strong bullish confirmation (like a bullish engulfing or volume spike), this breakout path is speculative.
4. Lack of Broader Context
Observation: The chart is isolated to a 1-hour timeframe.
Disruption: No higher timeframe trend is considered. If the 4H or Daily chart shows a downtrend, this small support could be insignificant and might break.
5. Volume Analysis Gaps
Observation: Volume bars are visible but not integrated into the analysis.
Disruption: No divergence or volume support is identified. Rising prices without rising volume can indicate a weak move, increasing failure chances.
Observation: The "Support" zone is marked around the 3,285–3,290 level.
Disruption: This area has only a few touches and lacks clear validation. Support should be confirmed with multiple bounces and strong volume reactions. Here, volume is present but inconclusive.
2. Overly Optimistic Target
Observation: The target area is set around 3,350, which assumes a clean breakout.
Disruption: This ignores potential resistance levels between 3,310–3,330 that could act as hurdles. The price might stall or reverse before reaching that far.
3. Breakout Path Assumptions
Observation: The blue arrows suggest a bullish breakout, possibly after a retest.
Disruption: There's a strong red rejection candle marked by a red arrow—suggesting bearish momentum. Without strong bullish confirmation (like a bullish engulfing or volume spike), this breakout path is speculative.
4. Lack of Broader Context
Observation: The chart is isolated to a 1-hour timeframe.
Disruption: No higher timeframe trend is considered. If the 4H or Daily chart shows a downtrend, this small support could be insignificant and might break.
5. Volume Analysis Gaps
Observation: Volume bars are visible but not integrated into the analysis.
Disruption: No divergence or volume support is identified. Rising prices without rising volume can indicate a weak move, increasing failure chances.

Declinazione di responsabilità
Le informazioni e le pubblicazioni non sono intese come, e non costituiscono, consulenza o raccomandazioni finanziarie, di investimento, di trading o di altro tipo fornite o approvate da TradingView. Per ulteriori informazioni, consultare i Termini di utilizzo.
Declinazione di responsabilità
Le informazioni e le pubblicazioni non sono intese come, e non costituiscono, consulenza o raccomandazioni finanziarie, di investimento, di trading o di altro tipo fornite o approvate da TradingView. Per ulteriori informazioni, consultare i Termini di utilizzo.