
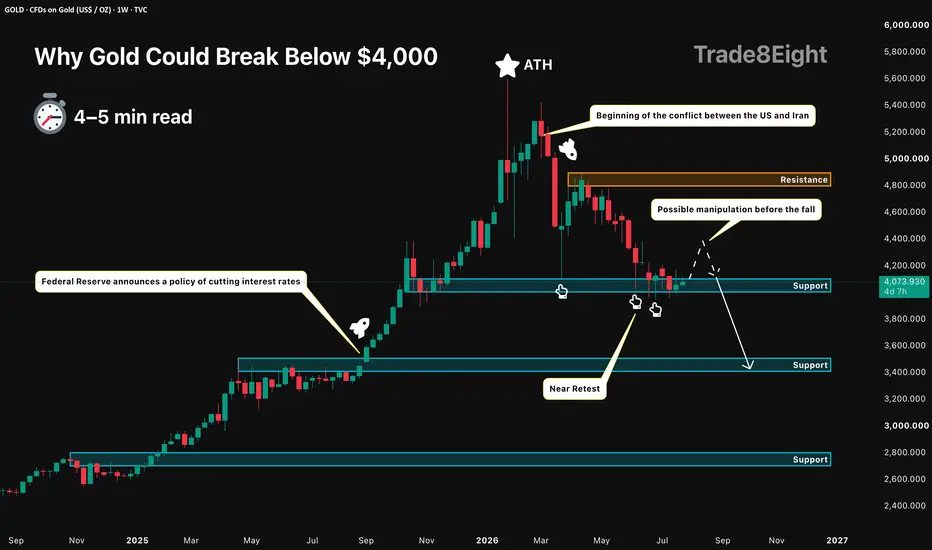
Gold is sitting on the level that now separates consolidation from a much deeper correction. On the weekly chart, price is testing the marked support around $4,000 after failing to sustain its recovery below the major resistance zone near $4,800.
The first pressure point is the US dollar. During ordinary risk-off periods, gold may benefit from defensive demand. But when risk reduction becomes a broader liquidity event, investors often sell positions across multiple markets and move into dollar cash. A renewed dollar bid would make gold more expensive for non-US buyers and could place additional pressure on investment demand.
The second factor is the changing interest-rate outlook. CME FedWatch currently implies roughly a 79% probability of a Federal Reserve rate increase in September. Higher policy-rate expectations tend to support the dollar and push nominal and real yields higher. Since gold produces no yield, its relative attractiveness declines as the return available from cash and government bonds increases.
Investment flows are already showing signs of pressure. Physically backed gold ETFs recorded $8.9 billion of outflows in June, while total holdings declined by 74 tonnes. North American funds experienced the largest withdrawals. Global flows remained positive over the full first half of the year, so this is not evidence of a complete structural exit from gold, but it does show that marginal Western demand has weakened as expectations for tighter monetary policy have increased.
There is also no clear physical shortage forcing the market higher. Total gold supply increased by 2% year over year in the first quarter. Mine production reached a record first-quarter level of almost 885 tonnes, while recycling rose by 5%. Industrial and technology demand remains strategically important, especially for electronics and AI infrastructure, but at 82 tonnes it is still relatively small compared with investment, jewellery and central-bank demand.
The technical structure brings these fundamental pressures together. Since March, gold has repeatedly returned to the same support area without producing a sustainable recovery. Price is now forming lower highs while spending more time close to the lower boundary. This resembles bearish compression rather than a strong rejection from support.
A temporary move higher is still possible. The chart allows for a short squeeze or a false recovery before sellers regain control. However, repeated Near Retests can gradually absorb the resting demand protecting a level. If buyers cannot create meaningful distance from $4,000, another test becomes more likely, and each new test may leave the support increasingly vulnerable.
🎓 The logic behind this market view is explained in more detail in my education material, which can be found in Related publications: “Near and Far Retests: What Every Trader Should Know”
If this post was useful, feel free to boost 🚀 it and share your view in the comments 💬
⚠️ Disclaimer: This is a public market view based on current analysis; market conditions and price direction are subject to change based on news factors and volatility. This is not financial advice. Please do your own research and manage your risk.
The first pressure point is the US dollar. During ordinary risk-off periods, gold may benefit from defensive demand. But when risk reduction becomes a broader liquidity event, investors often sell positions across multiple markets and move into dollar cash. A renewed dollar bid would make gold more expensive for non-US buyers and could place additional pressure on investment demand.
The second factor is the changing interest-rate outlook. CME FedWatch currently implies roughly a 79% probability of a Federal Reserve rate increase in September. Higher policy-rate expectations tend to support the dollar and push nominal and real yields higher. Since gold produces no yield, its relative attractiveness declines as the return available from cash and government bonds increases.
Investment flows are already showing signs of pressure. Physically backed gold ETFs recorded $8.9 billion of outflows in June, while total holdings declined by 74 tonnes. North American funds experienced the largest withdrawals. Global flows remained positive over the full first half of the year, so this is not evidence of a complete structural exit from gold, but it does show that marginal Western demand has weakened as expectations for tighter monetary policy have increased.
There is also no clear physical shortage forcing the market higher. Total gold supply increased by 2% year over year in the first quarter. Mine production reached a record first-quarter level of almost 885 tonnes, while recycling rose by 5%. Industrial and technology demand remains strategically important, especially for electronics and AI infrastructure, but at 82 tonnes it is still relatively small compared with investment, jewellery and central-bank demand.
The technical structure brings these fundamental pressures together. Since March, gold has repeatedly returned to the same support area without producing a sustainable recovery. Price is now forming lower highs while spending more time close to the lower boundary. This resembles bearish compression rather than a strong rejection from support.
A temporary move higher is still possible. The chart allows for a short squeeze or a false recovery before sellers regain control. However, repeated Near Retests can gradually absorb the resting demand protecting a level. If buyers cannot create meaningful distance from $4,000, another test becomes more likely, and each new test may leave the support increasingly vulnerable.
🎓 The logic behind this market view is explained in more detail in my education material, which can be found in Related publications: “Near and Far Retests: What Every Trader Should Know”
If this post was useful, feel free to boost 🚀 it and share your view in the comments 💬
⚠️ Disclaimer: This is a public market view based on current analysis; market conditions and price direction are subject to change based on news factors and volatility. This is not financial advice. Please do your own research and manage your risk.

⚠️ Public market view only. Not financial advice. DYOR and manage your own risk.
Pubblicazioni correlate
Declinazione di responsabilità
Le informazioni e le pubblicazioni non sono intese come, e non costituiscono, consulenza o raccomandazioni finanziarie, di investimento, di trading o di altro tipo fornite o approvate da TradingView. Per ulteriori informazioni, consultare i Termini di utilizzo.
⚠️ Public market view only. Not financial advice. DYOR and manage your own risk.
Pubblicazioni correlate
Declinazione di responsabilità
Le informazioni e le pubblicazioni non sono intese come, e non costituiscono, consulenza o raccomandazioni finanziarie, di investimento, di trading o di altro tipo fornite o approvate da TradingView. Per ulteriori informazioni, consultare i Termini di utilizzo.