
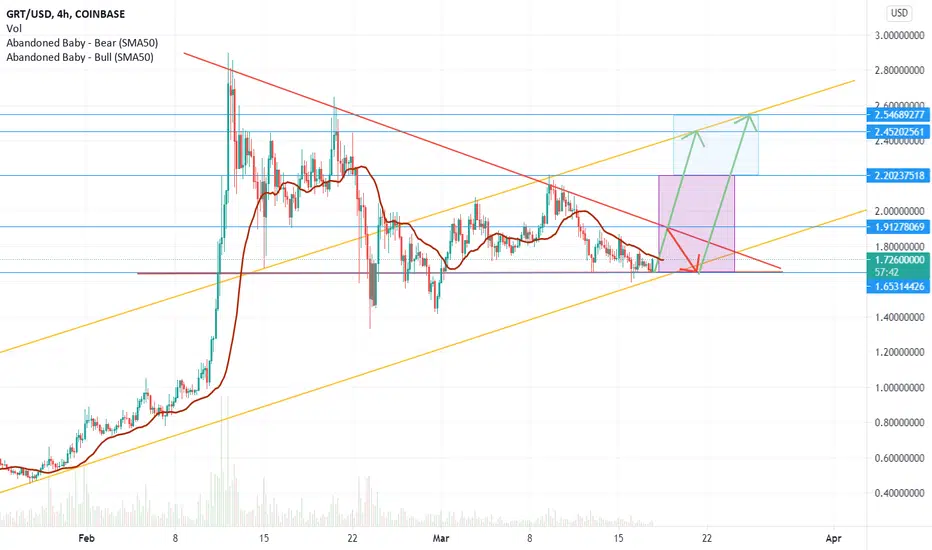
The graph has been consolidating in this bullish flag for almost an entire month. Two possible scenarios could playout:
First: GRT could bounce off the top trendline of the flag at $1.91 descending back to $1.65 price range, which has shown very strong support, before breaking out and uptrending to $2.54 price
Second: It bust through the top trend line passing $1.91 then on to retest $2.20 before ending up at the $2.45 TP
First: GRT could bounce off the top trendline of the flag at $1.91 descending back to $1.65 price range, which has shown very strong support, before breaking out and uptrending to $2.54 price
Second: It bust through the top trend line passing $1.91 then on to retest $2.20 before ending up at the $2.45 TP

Declinazione di responsabilità
Le informazioni e le pubblicazioni non sono intese come, e non costituiscono, consulenza o raccomandazioni finanziarie, di investimento, di trading o di altro tipo fornite o approvate da TradingView. Per ulteriori informazioni, consultare i Termini di utilizzo.
Declinazione di responsabilità
Le informazioni e le pubblicazioni non sono intese come, e non costituiscono, consulenza o raccomandazioni finanziarie, di investimento, di trading o di altro tipo fornite o approvate da TradingView. Per ulteriori informazioni, consultare i Termini di utilizzo.