GVT 3/5
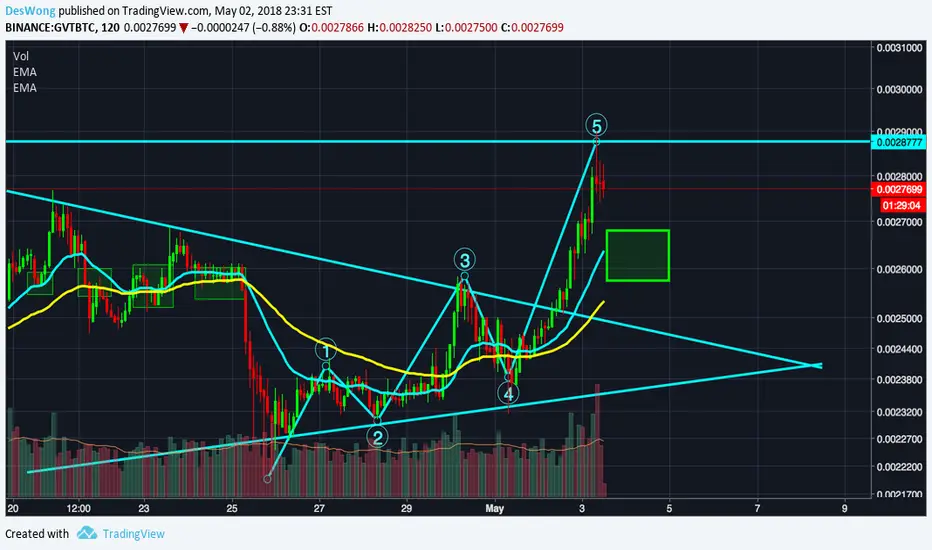
On a 2 hour chart, a hanging man has formed with its wick hit on the resistance and a doji with high volume have formed, RSI is overbought as well, it indicates the bull has lost its steam. So, a temporary correction is due.
The previous 25700 strong resistance has now become a strong support, expect a bounce from there.
Again, it is not financial advice and this chart is mainly for people who day-trade or swing-trade. For long term investor, you can ignore this short term price fluctuation.
The previous 25700 strong resistance has now become a strong support, expect a bounce from there.
Again, it is not financial advice and this chart is mainly for people who day-trade or swing-trade. For long term investor, you can ignore this short term price fluctuation.

Declinazione di responsabilità
Le informazioni e le pubblicazioni non sono intese come, e non costituiscono, consulenza o raccomandazioni finanziarie, di investimento, di trading o di altro tipo fornite o approvate da TradingView. Per ulteriori informazioni, consultare i Termini di utilizzo.
Declinazione di responsabilità
Le informazioni e le pubblicazioni non sono intese come, e non costituiscono, consulenza o raccomandazioni finanziarie, di investimento, di trading o di altro tipo fornite o approvate da TradingView. Per ulteriori informazioni, consultare i Termini di utilizzo.