Long
HAPI Bottomed?
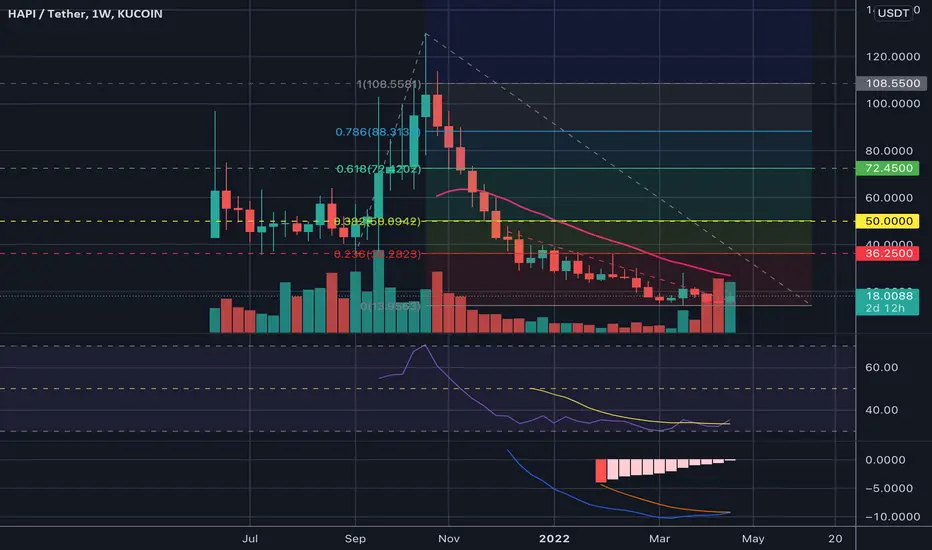
HAPI/USD (Weekly)
- Seem to have found Support at approx. the $15-16 area and range-bound for a while.
- MACD/Signal and Histogram reversing
- Volume increasing over the last 3 weeks
- RSI low reversing
- Looks to be closing above the 50MA on the daily
- Resistance levels marked out by the fib extension (String Resistance will be at $50 and approx $72 area. If we can break above with strength, we should be forming a new high.
- Strong Resistance at the $50 level shown by the Volume Profile
- Seem to have found Support at approx. the $15-16 area and range-bound for a while.
- MACD/Signal and Histogram reversing
- Volume increasing over the last 3 weeks
- RSI low reversing
- Looks to be closing above the 50MA on the daily
- Resistance levels marked out by the fib extension (String Resistance will be at $50 and approx $72 area. If we can break above with strength, we should be forming a new high.
- Strong Resistance at the $50 level shown by the Volume Profile

Declinazione di responsabilità
Le informazioni e le pubblicazioni non sono intese come, e non costituiscono, consulenza o raccomandazioni finanziarie, di investimento, di trading o di altro tipo fornite o approvate da TradingView. Per ulteriori informazioni, consultare i Termini di utilizzo.
Declinazione di responsabilità
Le informazioni e le pubblicazioni non sono intese come, e non costituiscono, consulenza o raccomandazioni finanziarie, di investimento, di trading o di altro tipo fornite o approvate da TradingView. Per ulteriori informazioni, consultare i Termini di utilizzo.