
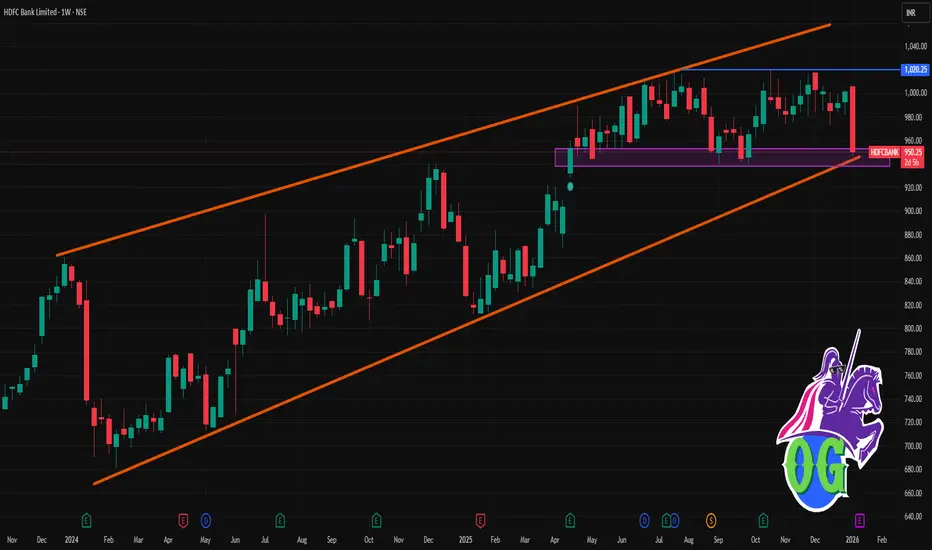
📌 Current Context (approx live price):
HDFC Bank shares are trading around ~₹950–₹970 on NSE recently.
📊 Key Weekly Levels (Short‑Term)
Resistance Levels (Upside)
R1: ~ ₹1,009 – ₹1,010 — first major resistance this week.
R2: ~ ₹1,016 – ₹1,017 — stronger supply zone if the stock pushes higher.
R3: ~ ₹1,025 – ₹1,030 — extended resistance early next week if buyers continue.
Support Levels (Downside)
S1: ~ ₹988 – ₹990 — immediate support zone this week.
S2: ~ ₹974 – ₹975 — second support if selling pressure increases.
S3: ~ ₹967 – ₹970 — lower band of the expected weekly trading range.
Projected Weekly Range:
👉 ~₹967 – ₹1,030 based on weekly pivot calculations and technical outlook.
🔍 How to Use These Levels This Week
Bullish scenario:
A sustained close above ~₹1,009–₹1,010 on daily closes could push price toward ₹1,016–₹1,030 in the next few sessions.
Bearish / stress scenario:
A break and close below ~₹974–₹970 could open space toward the ₹950–₹940 area (short‑term demand zones).

Contact Knowledgehub for a detailed consultation: Dm on WhatsApp: [wa.link/a2o0kz]-
Phone No: [+91 93102 26243]-
Email: [tradingviewknowledgehub@gmail.com]---
-- Let’s achieve success together!
Phone No: [+91 93102 26243]-
Email: [tradingviewknowledgehub@gmail.com]---
-- Let’s achieve success together!
Pubblicazioni correlate
Declinazione di responsabilità
Le informazioni e le pubblicazioni non sono intese come, e non costituiscono, consulenza o raccomandazioni finanziarie, di investimento, di trading o di altro tipo fornite o approvate da TradingView. Per ulteriori informazioni, consultare i Termini di utilizzo.