
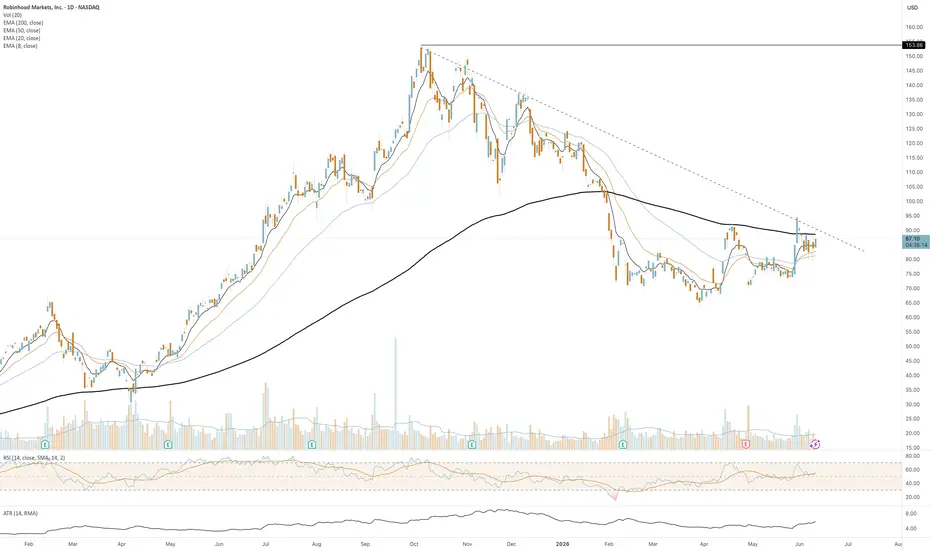
Robinhood has quietly gone from one of the market’s biggest laggards to one of its most interesting charts.
After a brutal correction from the $153 highs, HOOD spent months repairing the damage, building a base, reclaiming key moving averages, and now finds itself pressing into a major confluence zone.
Price is sitting just beneath a long-term descending trendline while simultaneously battling for control of the 200-day EMA.
That’s exactly the kind of setup that can produce a meaningful move.
📊 What I’m Watching
• Higher lows have been building since the April bottom
• Price has reclaimed the 20, 50, and 200 EMAs
• Descending trendline resistance is coming into play
• Volume has remained healthy during the recovery
• RSI is holding above 50 and trending higher
• Volatility has contracted as price compresses
The bulls have a strong argument here.
The stock has spent months working off excesses from the prior run while establishing a healthier structure. Instead of immediately rolling over at resistance, HOOD is consolidating beneath it. That’s often how strong stocks behave before attempting a breakout.
A decisive move through the downtrend line could open the door to a retest of the prior highs near $150.
After a brutal correction from the $153 highs, HOOD spent months repairing the damage, building a base, reclaiming key moving averages, and now finds itself pressing into a major confluence zone.
Price is sitting just beneath a long-term descending trendline while simultaneously battling for control of the 200-day EMA.
That’s exactly the kind of setup that can produce a meaningful move.
📊 What I’m Watching
• Higher lows have been building since the April bottom
• Price has reclaimed the 20, 50, and 200 EMAs
• Descending trendline resistance is coming into play
• Volume has remained healthy during the recovery
• RSI is holding above 50 and trending higher
• Volatility has contracted as price compresses
The bulls have a strong argument here.
The stock has spent months working off excesses from the prior run while establishing a healthier structure. Instead of immediately rolling over at resistance, HOOD is consolidating beneath it. That’s often how strong stocks behave before attempting a breakout.
A decisive move through the downtrend line could open the door to a retest of the prior highs near $150.
Trade attivo
This one was pretty obvious. $87-$105. Stops moved up and riding this higher.Nota
$108 and climbing
TraderSWRLS
Declinazione di responsabilità
Le informazioni e le pubblicazioni non sono intese come, e non costituiscono, consulenza o raccomandazioni finanziarie, di investimento, di trading o di altro tipo fornite o approvate da TradingView. Per ulteriori informazioni, consultare i Termini di utilizzo.
TraderSWRLS
Declinazione di responsabilità
Le informazioni e le pubblicazioni non sono intese come, e non costituiscono, consulenza o raccomandazioni finanziarie, di investimento, di trading o di altro tipo fornite o approvate da TradingView. Per ulteriori informazioni, consultare i Termini di utilizzo.