
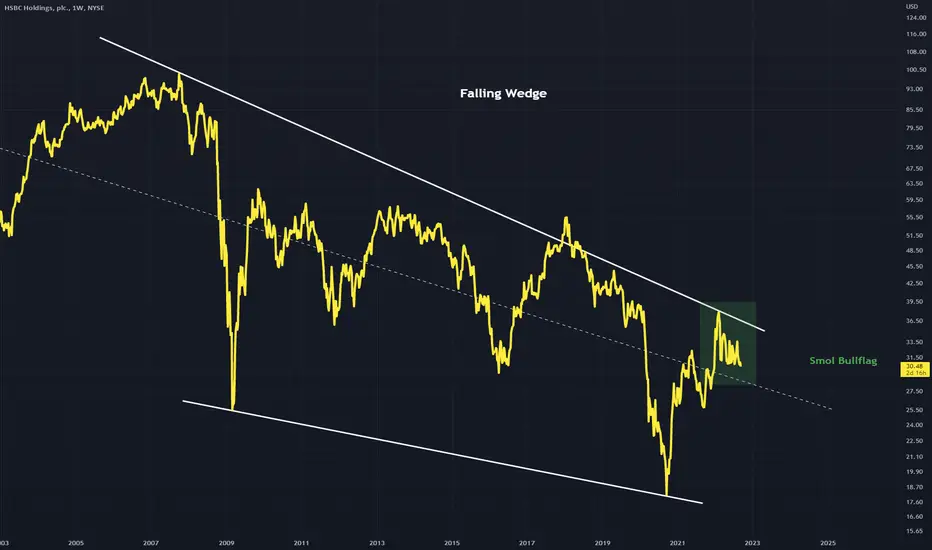
Falling Wedge structure using the peaks and troughs of price
The middle dashed line is the strongest trend line (down)
A small bullflag can also be seen forming at the bottom of this falling wedge
Will a trend change be the result?
Weekly timeframe
The middle dashed line is the strongest trend line (down)
A small bullflag can also be seen forming at the bottom of this falling wedge
Will a trend change be the result?
Weekly timeframe

Declinazione di responsabilità
Le informazioni e le pubblicazioni non sono intese come, e non costituiscono, consulenza o raccomandazioni finanziarie, di investimento, di trading o di altro tipo fornite o approvate da TradingView. Per ulteriori informazioni, consultare i Termini di utilizzo.
Declinazione di responsabilità
Le informazioni e le pubblicazioni non sono intese come, e non costituiscono, consulenza o raccomandazioni finanziarie, di investimento, di trading o di altro tipo fornite o approvate da TradingView. Per ulteriori informazioni, consultare i Termini di utilizzo.