
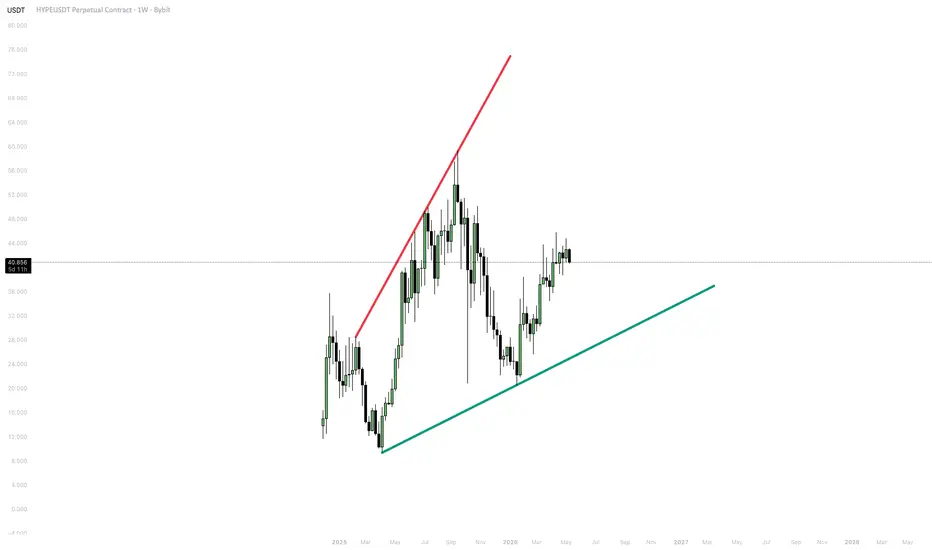
A complete practitioner's guide to drawing, validating, and trading trendlines — from the first touch to the breakout.
WHAT IS A TRENDLINE?
A trendline is a straight line drawn across two or more significant swing points on a chart. It acts as a dynamic level of support or resistance that moves with price over time. Unlike horizontal levels, trendlines encode the speed of a trend — the steeper the angle, the more aggressive the move.
Trendlines are one of the oldest tools in technical analysis, yet consistently misused. Most traders draw them too freely — from noise rather than validated structure. This framework sets it straight.
Core idea: A trendline doesn't predict the future — it defines the current trend's structure. When price respects it, the trend is intact. When it breaks, conditions have changed.
THE THREE RULES OF VALID TRENDLINES
Most charting errors come from ignoring one of these. Apply all three — or the line is decoration, not analysis.
Rule 1 — Minimum two touches (three to validate)
Two points define any line. Three touches validate it as structural. One touch is a hypothesis, not a trendline.
Rule 2 — Draw from wicks, not bodies
Trendlines anchor to price extremes — wick highs and lows — not candle bodies. Bodies represent where most volume transacted. Wicks show true rejection.
Rule 3 — Higher timeframe first
Always identify the trendline on a higher timeframe (daily, weekly) before dropping to lower timeframes for entries.
Rule 4 — Respect the angle
Trendlines steeper than 45° are unsustainable. Very shallow lines carry less significance. The ideal range is 20–45°.
TYPES OF TRENDLINES
① Uptrend Line (Support)

② Downtrend Line (Resistance)

③ Channel Lines

A channel is formed by drawing a parallel line on the opposite side of the primary trendline. The space between both lines becomes a bounded trading range. Price tends to oscillate between the two boundaries — offering both continuation and reversal setups at well-defined levels.
HOW TO DRAW TRENDLINES CORRECTLY — STEP BY STEP
Step 1 — Start on the higher timeframe
Open the daily or weekly chart. Identify the major trend direction by observing the sequence of swing highs and lows.

Step 2 — Identify two significant swing points
For an uptrend, find two distinct higher lows. For a downtrend, find two lower highs. These must be structural swings — not micro-noise.

Step 3 — Connect wick extremes
Draw the line through the tips of the wicks, not the candle bodies. If a wick slightly penetrates the line, that is acceptable — what matters is a clean close beyond it.
Step 4 — Wait for a third touch
The third touch validates the trendline as a genuine structural level. This is where your highest-probability setups occur.
Step 5 — Zoom in for entry precision
Once a third touch is approaching on the higher timeframe, drop to the 1H or 15M chart to time your entry with a candlestick confirmation signal.
Pro tip: The most powerful trendlines are those that required adjustment over time — lines you had to redraw slightly as new swings formed. A trendline that has "grown with the chart" carries more structural weight than one drawn in a single session.
ENTRY FRAMEWORKS AT A TRENDLINE
① Aggressive — Touch Entry
Enter as soon as price touches the trendline. Best risk/reward ratio, but highest failure rate. Requires strong trend context and prior validation.

② Standard — Candle Confirmation
Wait for a reversal candle (pin bar, bullish/bearish engulfing) to close at the trendline before entering. Balances risk/reward with confidence.

③ Conservative — Retest Entry
Wait for a confirmed break of the trendline, then re-enter on a pullback to it acting as flipped support or resistance. Lower risk/reward ratio, but highest reliability.

④ Breakout — Momentum Entry
Enter on a confirmed close beyond the trendline, ideally with expanding volume. Best for trending markets transitioning into new structure.

Stop Placement Rules
TRENDLINE BREAKS — WHAT THEY REALLY MEAN
A trendline break is not automatically a reversal signal. There are three possible outcomes:
① Consolidation Break
Price breaks, then chops sideways. The trend is pausing, not reversing. No trade until new structure forms.
② Reversal Break
Price breaks cleanly with momentum and immediately begins forming opposite structure — lower highs after an uptrend break, for example. True trend change. Look for opportunity in the new direction.
③ False Break / Trap
Price breaks the trendline on a wick, then snaps back sharply. Stops are hunted. The trend often accelerates in the original direction after the trap is set.
Warning: Never trade a trendline break on a wick alone. Require a candle close on the other side of the trendline for a valid break. Wick breaks are the most common stop-hunt mechanism used by institutional players.
CONFLUENCE — WHERE TRENDLINES BECOME HIGH-PROBABILITY
A trendline in isolation is useful. A trendline that aligns with other technical factors becomes a significantly higher-probability trade location. Always check for confluence before committing capital.
COMMON MISTAKES TO AVOID
✗ Drawing lines through price action
A valid trendline sits at the edge of price. If you have to cut through multiple candles to connect two points, the line is forced and invalid.
✗ Anchoring to candle bodies instead of wicks
Candle bodies reflect where most trading happened. Wicks show the full extent of price rejection. Trendlines are about extremes.
✗ Trading two-touch lines
Two points define a line — they do not validate a structural level. Always wait for a third touch to confirm the line has meaning in the market.
✗ Ignoring the higher timeframe trend
Trading a trendline bounce that goes counter to the dominant weekly or monthly trend puts the full weight of market structure against you.
✗ Constantly redrawing to fit price
If you're adjusting your trendline every session to keep price "above" it, the trend has already broken and you're in denial. Let the market invalidate your thesis — don't protect the line.
KEY TAKEAWAYS
WHAT IS A TRENDLINE?
A trendline is a straight line drawn across two or more significant swing points on a chart. It acts as a dynamic level of support or resistance that moves with price over time. Unlike horizontal levels, trendlines encode the speed of a trend — the steeper the angle, the more aggressive the move.
Trendlines are one of the oldest tools in technical analysis, yet consistently misused. Most traders draw them too freely — from noise rather than validated structure. This framework sets it straight.
Core idea: A trendline doesn't predict the future — it defines the current trend's structure. When price respects it, the trend is intact. When it breaks, conditions have changed.
THE THREE RULES OF VALID TRENDLINES
Most charting errors come from ignoring one of these. Apply all three — or the line is decoration, not analysis.
Rule 1 — Minimum two touches (three to validate)
Two points define any line. Three touches validate it as structural. One touch is a hypothesis, not a trendline.
Rule 2 — Draw from wicks, not bodies
Trendlines anchor to price extremes — wick highs and lows — not candle bodies. Bodies represent where most volume transacted. Wicks show true rejection.
Rule 3 — Higher timeframe first
Always identify the trendline on a higher timeframe (daily, weekly) before dropping to lower timeframes for entries.
Rule 4 — Respect the angle
Trendlines steeper than 45° are unsustainable. Very shallow lines carry less significance. The ideal range is 20–45°.
TYPES OF TRENDLINES
① Uptrend Line (Support)
- Drawn below price, connecting a series of higher lows
- Acts as dynamic support in a bullish trend
- A break signals potential trend exhaustion or reversal
- Trade setup: buy the touch, stop below the previous swing low
② Downtrend Line (Resistance)
- Drawn above price, connecting a series of lower highs
- Acts as dynamic resistance in a bearish trend
- A break signals potential reversal or trend acceleration to upside
- Trade setup: sell the touch, stop above the previous swing high
③ Channel Lines
A channel is formed by drawing a parallel line on the opposite side of the primary trendline. The space between both lines becomes a bounded trading range. Price tends to oscillate between the two boundaries — offering both continuation and reversal setups at well-defined levels.
HOW TO DRAW TRENDLINES CORRECTLY — STEP BY STEP
Step 1 — Start on the higher timeframe
Open the daily or weekly chart. Identify the major trend direction by observing the sequence of swing highs and lows.
Step 2 — Identify two significant swing points
For an uptrend, find two distinct higher lows. For a downtrend, find two lower highs. These must be structural swings — not micro-noise.
Step 3 — Connect wick extremes
Draw the line through the tips of the wicks, not the candle bodies. If a wick slightly penetrates the line, that is acceptable — what matters is a clean close beyond it.
Step 4 — Wait for a third touch
The third touch validates the trendline as a genuine structural level. This is where your highest-probability setups occur.
Step 5 — Zoom in for entry precision
Once a third touch is approaching on the higher timeframe, drop to the 1H or 15M chart to time your entry with a candlestick confirmation signal.
Pro tip: The most powerful trendlines are those that required adjustment over time — lines you had to redraw slightly as new swings formed. A trendline that has "grown with the chart" carries more structural weight than one drawn in a single session.
ENTRY FRAMEWORKS AT A TRENDLINE
① Aggressive — Touch Entry
Enter as soon as price touches the trendline. Best risk/reward ratio, but highest failure rate. Requires strong trend context and prior validation.
② Standard — Candle Confirmation
Wait for a reversal candle (pin bar, bullish/bearish engulfing) to close at the trendline before entering. Balances risk/reward with confidence.
③ Conservative — Retest Entry
Wait for a confirmed break of the trendline, then re-enter on a pullback to it acting as flipped support or resistance. Lower risk/reward ratio, but highest reliability.
④ Breakout — Momentum Entry
Enter on a confirmed close beyond the trendline, ideally with expanding volume. Best for trending markets transitioning into new structure.
Stop Placement Rules
- Uptrend long: Place stop 1–2 ATR below the previous swing low that created the trendline touch point
- Downtrend short: Place stop 1–2 ATR above the previous swing high that created the resistance touch point
- Breakout trade: Stop goes on the far side of the trendline — if former resistance breaks up, stop sits below that trendline on the retest
TRENDLINE BREAKS — WHAT THEY REALLY MEAN
A trendline break is not automatically a reversal signal. There are three possible outcomes:
① Consolidation Break
Price breaks, then chops sideways. The trend is pausing, not reversing. No trade until new structure forms.
② Reversal Break
Price breaks cleanly with momentum and immediately begins forming opposite structure — lower highs after an uptrend break, for example. True trend change. Look for opportunity in the new direction.
③ False Break / Trap
Price breaks the trendline on a wick, then snaps back sharply. Stops are hunted. The trend often accelerates in the original direction after the trap is set.
Warning: Never trade a trendline break on a wick alone. Require a candle close on the other side of the trendline for a valid break. Wick breaks are the most common stop-hunt mechanism used by institutional players.
CONFLUENCE — WHERE TRENDLINES BECOME HIGH-PROBABILITY
A trendline in isolation is useful. A trendline that aligns with other technical factors becomes a significantly higher-probability trade location. Always check for confluence before committing capital.
- Horizontal Support / Resistance: Trendline aligns with a major horizontal level — double confirmation from two independent methods
- Fibonacci Levels: Trendline coincides with a 38.2%, 50%, or 61.8% retracement — particularly powerful at the 61.8% (golden ratio)
- Moving Averages: Price approaches the trendline near the 20, 50, or 200 EMA — the MA acts as a secondary magnet reinforcing the zone
- Round Numbers / Psychological Levels: Trendline proximity to key psychological levels (1.0000, 50,000, etc.) adds institutional weight to the area
- Volume Nodes: Trendline sits near a high-volume node on the volume profile — institutions defend levels where they built positions
COMMON MISTAKES TO AVOID
✗ Drawing lines through price action
A valid trendline sits at the edge of price. If you have to cut through multiple candles to connect two points, the line is forced and invalid.
✗ Anchoring to candle bodies instead of wicks
Candle bodies reflect where most trading happened. Wicks show the full extent of price rejection. Trendlines are about extremes.
✗ Trading two-touch lines
Two points define a line — they do not validate a structural level. Always wait for a third touch to confirm the line has meaning in the market.
✗ Ignoring the higher timeframe trend
Trading a trendline bounce that goes counter to the dominant weekly or monthly trend puts the full weight of market structure against you.
✗ Constantly redrawing to fit price
If you're adjusting your trendline every session to keep price "above" it, the trend has already broken and you're in denial. Let the market invalidate your thesis — don't protect the line.
KEY TAKEAWAYS
- Two points define a trendline — three points validate it. Only trade on validated lines
- Anchor to wick extremes, not candle bodies. Wicks show true price rejection
- A trendline break requires a candle close beyond the line — wick breaks are traps
- The highest-probability setups occur when trendlines coincide with horizontal S/R, Fibonacci levels, or key moving averages
- Always trade with the higher timeframe trend — counter-trend trendline trades carry significantly more risk
- Stops belong where the thesis is invalidated: below the swing low for longs, above the swing high for shorts
- The best trendlines are drawn once and respected many times. If you're redrawing constantly, the market is telling you something

🔵 Tools that give you the edge: candelacharts.com/.
🔵 Join our free discord for updates: candelacharts.com/community
🔵 Join our free discord for updates: candelacharts.com/community
Declinazione di responsabilità
Le informazioni e le pubblicazioni non sono intese come, e non costituiscono, consulenza o raccomandazioni finanziarie, di investimento, di trading o di altro tipo fornite o approvate da TradingView. Per ulteriori informazioni, consultare i Termini di utilizzo.
🔵 Tools that give you the edge: candelacharts.com/.
🔵 Join our free discord for updates: candelacharts.com/community
🔵 Join our free discord for updates: candelacharts.com/community
Declinazione di responsabilità
Le informazioni e le pubblicazioni non sono intese come, e non costituiscono, consulenza o raccomandazioni finanziarie, di investimento, di trading o di altro tipo fornite o approvate da TradingView. Per ulteriori informazioni, consultare i Termini di utilizzo.