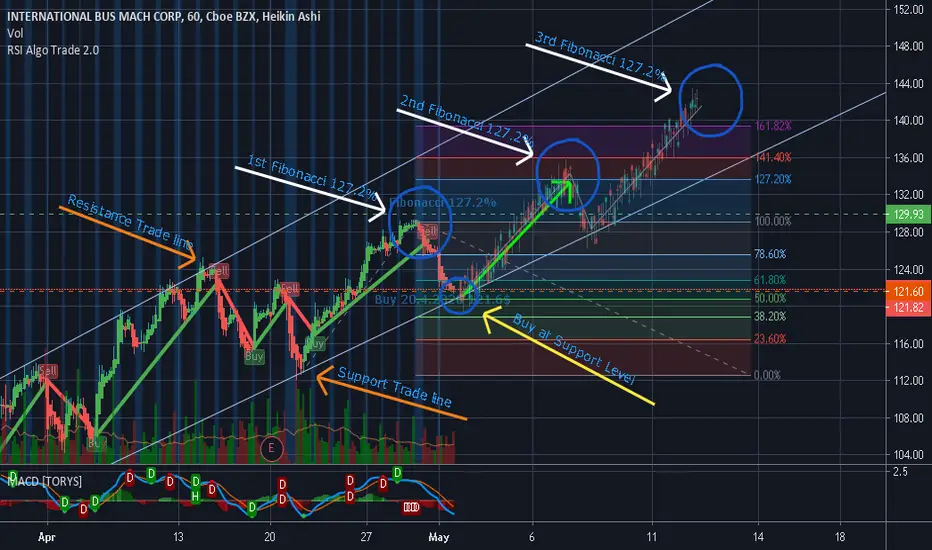
This trade analysis based on two levels, the support trade line and the resistance trade line (Orange color arrow).
When the stock IBM reach the 1st Fibonacci 127.2% it follow the Fibonacci retrace down to 61% - 50% and reach the Support trade line. At this moment, around 121$, its the time to take a profit at the 2nd Fibonacci 127% level. As well as for the 3rd ..... (144$)
When you look the MACD indicator it's will be the good time to buy the stock at low level
When the stock
IBM reach the 1st Fibonacci 127.2% it follow the Fibonacci retrace down to 61% - 50% and reach the Support trade line. At this moment, around 121$, its the time to take a profit at the 2nd Fibonacci 127% level. As well as for the 3rd ..... (144$)When you look the MACD indicator it's will be the good time to buy the stock at low level

Declinazione di responsabilità
Le informazioni e le pubblicazioni non sono intese come, e non costituiscono, consulenza o raccomandazioni finanziarie, di investimento, di trading o di altro tipo fornite o approvate da TradingView. Per ulteriori informazioni, consultare i Termini di utilizzo.
Declinazione di responsabilità
Le informazioni e le pubblicazioni non sono intese come, e non costituiscono, consulenza o raccomandazioni finanziarie, di investimento, di trading o di altro tipo fornite o approvate da TradingView. Per ulteriori informazioni, consultare i Termini di utilizzo.