
Topic Statement:
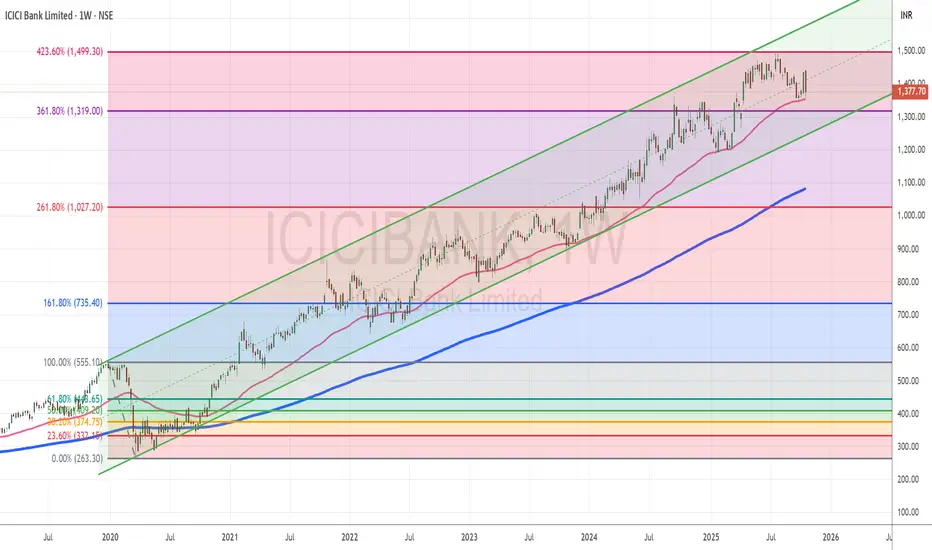
ICICI Bank continues its long-term bull run, supported consistently by technical levels, but now approaches a key resistance near the 1500 mark.
Key Points:
1. The stock trades reliably within a well-defined up-trending channel, maintaining long-term bullish structure
2. Price is repeatedly supported by the 50-day EMA, acting as a dynamic floor throughout its rallies
3. It has only dipped below the 200-day EMA during rare deep corrections, like the COVID crash of 2020
4. Based on the Fibonacci levels plotted from the 2020 correction, the 423.6% extension lies near 1500 — a level already reached, where the stock may now face stiff resistance
ICICI Bank continues its long-term bull run, supported consistently by technical levels, but now approaches a key resistance near the 1500 mark.
Key Points:
1. The stock trades reliably within a well-defined up-trending channel, maintaining long-term bullish structure
2. Price is repeatedly supported by the 50-day EMA, acting as a dynamic floor throughout its rallies
3. It has only dipped below the 200-day EMA during rare deep corrections, like the COVID crash of 2020
4. Based on the Fibonacci levels plotted from the 2020 correction, the 423.6% extension lies near 1500 — a level already reached, where the stock may now face stiff resistance

Declinazione di responsabilità
Le informazioni e le pubblicazioni non sono intese come, e non costituiscono, consulenza o raccomandazioni finanziarie, di investimento, di trading o di altro tipo fornite o approvate da TradingView. Per ulteriori informazioni, consultare i Termini di utilizzo.
Declinazione di responsabilità
Le informazioni e le pubblicazioni non sono intese come, e non costituiscono, consulenza o raccomandazioni finanziarie, di investimento, di trading o di altro tipo fornite o approvate da TradingView. Per ulteriori informazioni, consultare i Termini di utilizzo.