
Tech-Software Reversal? 3 Key Signals Confirming a Market Bottom
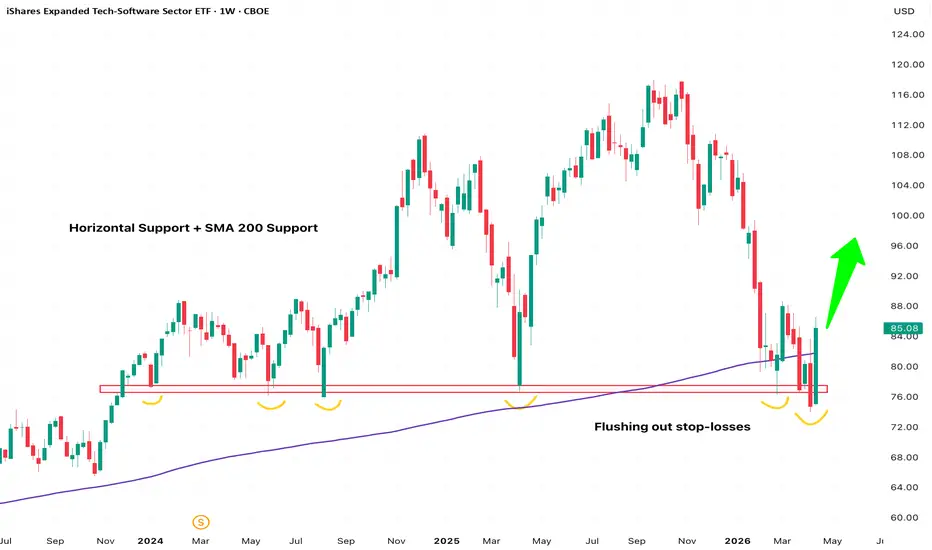
IGV Tech-Software Sector: Potential Bottom Confirmed by Key Technical Confluence
Based on the weekly chart of IGV (iShares Expanded Tech-Software Sector ETF), the price action suggests a solid base has been formed. Multiple bullish technical signals are converging, indicating a high probability of an upward reversal.
Here are the three core rationales supporting this bullish outlook:
Strong Horizontal Support: The price is currently consolidating in a critical demand zone around the $78 level. Historical data shows this horizontal support line has been tested and respected approximately 7 times. This repeated validation proves the level is highly effective with strong underlying buying interest.
Takeout Stops Pattern (False Breakdown): Between late March and early April, the price action executed a textbook liquidity grab (takeout stops). It briefly dipped below the established horizontal support—flushing out long stop-losses—before immediately reversing and closing green back above the line. This false breakdown is a strong reversal signal indicating institutional accumulation.
SMA 200 Support & Bullish Engulfing: The most recent weekly candle printed a powerful "Bullish Engulfing" pattern. Crucially, the closing price decisively reclaimed the long-term 200-Week Simple Moving Average (SMA 200).
Conclusion:
The exact overlapping of these three factors—a heavily tested horizontal base, a rapid takeout of stops, and the reclaiming of the 200-Week SMA—provides strong conviction that this zone is a recognized market bottom. This structure offers a highly favorable risk-to-reward ratio for mid-to-long-term positioning.
Risk Management:
Regardless of the high-probability setup, a disciplined trader must always implement a strict stop-loss to manage downside risk.
Based on the weekly chart of IGV (iShares Expanded Tech-Software Sector ETF), the price action suggests a solid base has been formed. Multiple bullish technical signals are converging, indicating a high probability of an upward reversal.
Here are the three core rationales supporting this bullish outlook:
Strong Horizontal Support: The price is currently consolidating in a critical demand zone around the $78 level. Historical data shows this horizontal support line has been tested and respected approximately 7 times. This repeated validation proves the level is highly effective with strong underlying buying interest.
Takeout Stops Pattern (False Breakdown): Between late March and early April, the price action executed a textbook liquidity grab (takeout stops). It briefly dipped below the established horizontal support—flushing out long stop-losses—before immediately reversing and closing green back above the line. This false breakdown is a strong reversal signal indicating institutional accumulation.
SMA 200 Support & Bullish Engulfing: The most recent weekly candle printed a powerful "Bullish Engulfing" pattern. Crucially, the closing price decisively reclaimed the long-term 200-Week Simple Moving Average (SMA 200).
Conclusion:
The exact overlapping of these three factors—a heavily tested horizontal base, a rapid takeout of stops, and the reclaiming of the 200-Week SMA—provides strong conviction that this zone is a recognized market bottom. This structure offers a highly favorable risk-to-reward ratio for mid-to-long-term positioning.
Risk Management:
Regardless of the high-probability setup, a disciplined trader must always implement a strict stop-loss to manage downside risk.

Declinazione di responsabilità
Le informazioni e le pubblicazioni non sono intese come, e non costituiscono, consulenza o raccomandazioni finanziarie, di investimento, di trading o di altro tipo fornite o approvate da TradingView. Per ulteriori informazioni, consultare i Termini di utilizzo.
Declinazione di responsabilità
Le informazioni e le pubblicazioni non sono intese come, e non costituiscono, consulenza o raccomandazioni finanziarie, di investimento, di trading o di altro tipo fornite o approvate da TradingView. Per ulteriori informazioni, consultare i Termini di utilizzo.