
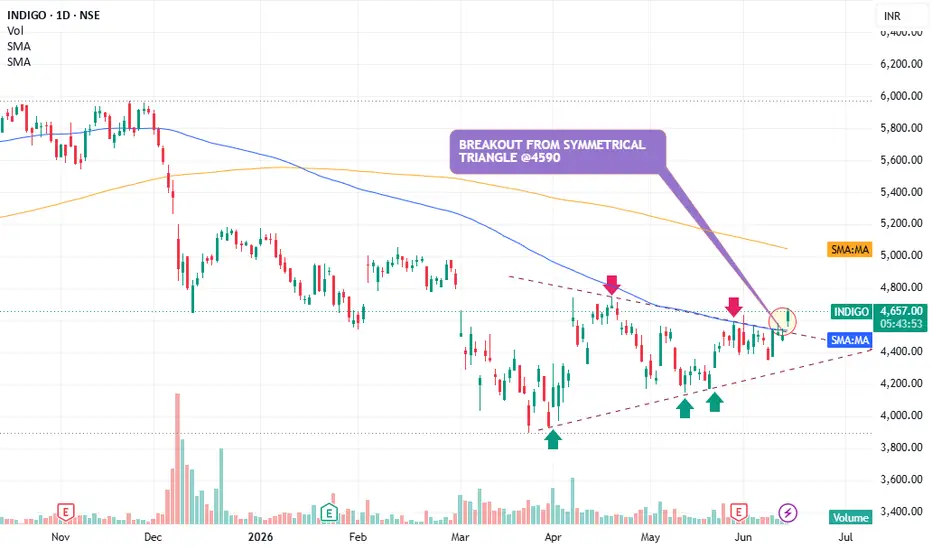
INDIGO (Daily Chart) – Technical Analysis
The chart shows a bullish breakout from a Symmetrical Triangle pattern, indicating that the consolidation phase may be ending and a fresh uptrend could be begin.
Key Observations
📈 1. Symmetrical Triangle Formation
Price has been making lower highs and higher lows since March.
This created a Symmetrical Triangle, showing a balance between buyers and sellers.
Such patterns usually lead to a strong move after breakout.
📈 2. Breakout Around ₹4,590
Price has broken above the triangle's upper trendline near ₹4,590.
The breakout is highlighted on the chart.
Current price is around ₹4,656, confirming strength above the breakout zone.
📈 3. Moving Average Support
The stock has moved above the 50-DMA (Blue Line) around ₹4,537.
The 50-DMA is now acting as immediate support.
Price sustaining above the 50-DMA is a positive sign.
📈 4. Higher Lows Formation
Green arrows indicate buyers stepping in at higher levels.
This reflects accumulation and strengthening demand.
📈 5. Volume Confirmation
Volume has improved during the breakout.
Strong volume adds credibility to the breakout and reduces the probability of a false move.
The chart shows a bullish breakout from a Symmetrical Triangle pattern, indicating that the consolidation phase may be ending and a fresh uptrend could be begin.
Key Observations
📈 1. Symmetrical Triangle Formation
Price has been making lower highs and higher lows since March.
This created a Symmetrical Triangle, showing a balance between buyers and sellers.
Such patterns usually lead to a strong move after breakout.
📈 2. Breakout Around ₹4,590
Price has broken above the triangle's upper trendline near ₹4,590.
The breakout is highlighted on the chart.
Current price is around ₹4,656, confirming strength above the breakout zone.
📈 3. Moving Average Support
The stock has moved above the 50-DMA (Blue Line) around ₹4,537.
The 50-DMA is now acting as immediate support.
Price sustaining above the 50-DMA is a positive sign.
📈 4. Higher Lows Formation
Green arrows indicate buyers stepping in at higher levels.
This reflects accumulation and strengthening demand.
📈 5. Volume Confirmation
Volume has improved during the breakout.
Strong volume adds credibility to the breakout and reduces the probability of a false move.

Declinazione di responsabilità
Le informazioni e le pubblicazioni non sono intese come, e non costituiscono, consulenza o raccomandazioni finanziarie, di investimento, di trading o di altro tipo fornite o approvate da TradingView. Per ulteriori informazioni, consultare i Termini di utilizzo.
Declinazione di responsabilità
Le informazioni e le pubblicazioni non sono intese come, e non costituiscono, consulenza o raccomandazioni finanziarie, di investimento, di trading o di altro tipo fornite o approvate da TradingView. Per ulteriori informazioni, consultare i Termini di utilizzo.