
Bias: Long
Duration: 4 to 12 weeks (Medium-term swing trade)
Technical Analysis:
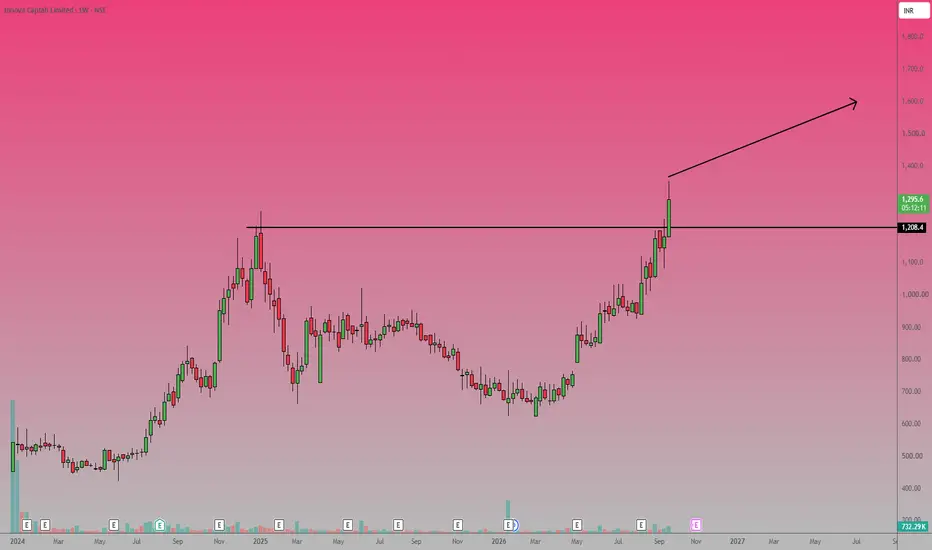
The weekly chart of Innova Captab Limited demonstrates a strong bullish breakout.
Price action has decisively crossed above a major horizontal resistance level at 1,208.4.
The stock spent the majority of 2024 and 2025 building a broad rounding base, followed by a steady higher-low accumulation phase.
The most recent weekly candle confirms the breakout, having opened at 1,179.8, hit a high of 1,353.5, and settled around 1,297.4 with a +9.97% gain.
This structural shift suggests the stock is entering a new markup phase above prior resistance.
Trade Setup:
Entry Point: Initiate a long position near the current market price of 1,297.4.
Alternatively, accumulate on a pullback to the 1,208.4 level, which is expected to flip from resistance to support.
Target: Set a primary profit target at 1,600, with a secondary target of 1,800 based on measuring the depth of the prior consolidation range.
Stop Loss: Place a hard stop loss at 1,050 (below the most recent pre-breakout consolidation phase) to invalidate the setup and protect against a false breakout.
Duration: 4 to 12 weeks (Medium-term swing trade)
Technical Analysis:
The weekly chart of Innova Captab Limited demonstrates a strong bullish breakout.
Price action has decisively crossed above a major horizontal resistance level at 1,208.4.
The stock spent the majority of 2024 and 2025 building a broad rounding base, followed by a steady higher-low accumulation phase.
The most recent weekly candle confirms the breakout, having opened at 1,179.8, hit a high of 1,353.5, and settled around 1,297.4 with a +9.97% gain.
This structural shift suggests the stock is entering a new markup phase above prior resistance.
Trade Setup:
Entry Point: Initiate a long position near the current market price of 1,297.4.
Alternatively, accumulate on a pullback to the 1,208.4 level, which is expected to flip from resistance to support.
Target: Set a primary profit target at 1,600, with a secondary target of 1,800 based on measuring the depth of the prior consolidation range.
Stop Loss: Place a hard stop loss at 1,050 (below the most recent pre-breakout consolidation phase) to invalidate the setup and protect against a false breakout.
Trade chiuso: stop raggiunto
Stop-Loss Hit...
Declinazione di responsabilità
Le informazioni e le pubblicazioni non sono intese come, e non costituiscono, consulenza o raccomandazioni finanziarie, di investimento, di trading o di altro tipo fornite o approvate da TradingView. Per ulteriori informazioni, consultare i Termini di utilizzo.
Declinazione di responsabilità
Le informazioni e le pubblicazioni non sono intese come, e non costituiscono, consulenza o raccomandazioni finanziarie, di investimento, di trading o di altro tipo fornite o approvate da TradingView. Per ulteriori informazioni, consultare i Termini di utilizzo.