
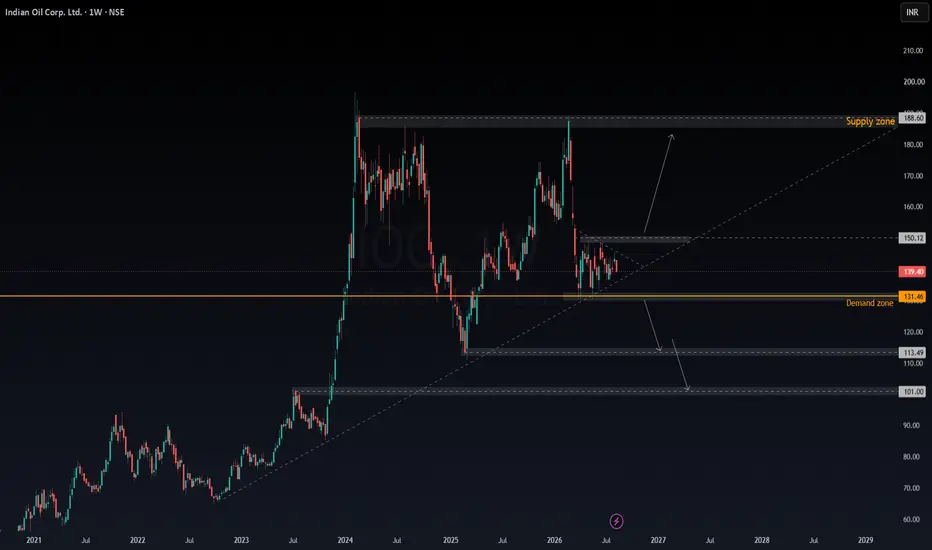
Indian Oil Corporation is currently trading in a consolidation phase on the weekly timeframe, with price moving between a major demand zone near ₹131–132 and an immediate resistance area around ₹145–150.
The bigger picture still looks constructive as long as the long-term rising structure remains intact. However, at the current level, I would prefer to wait for confirmation rather than anticipate the next move.
Bullish scenario:
A strong weekly close above ₹145–150, followed by a successful retest, could indicate that the consolidation is breaking to the upside. In that case, ₹160–170 could be the next area to watch, followed by the major supply zone around ₹185–189.
Bearish scenario:
If ₹131–132 fails to hold on a weekly closing basis, the structure could weaken significantly. In that case, ₹113–114 becomes the next important support, followed by the ₹101 area.
For me, the key levels are simple:
₹150 → bullish breakout confirmation
₹131–132 → major demand / support
₹113–114 → next downside support
₹101 → deeper support
₹185–189 → major supply zone
Right now, I'm treating this as a wait-for-confirmation setup rather than predicting the direction.
Let's see which side of the range price breaks first. 📈📉

Declinazione di responsabilità
Le informazioni e le pubblicazioni non sono intese come, e non costituiscono, consulenza o raccomandazioni finanziarie, di investimento, di trading o di altro tipo fornite o approvate da TradingView. Per ulteriori informazioni, consultare i Termini di utilizzo.
Declinazione di responsabilità
Le informazioni e le pubblicazioni non sono intese come, e non costituiscono, consulenza o raccomandazioni finanziarie, di investimento, di trading o di altro tipo fornite o approvate da TradingView. Per ulteriori informazioni, consultare i Termini di utilizzo.