
WEEKLY
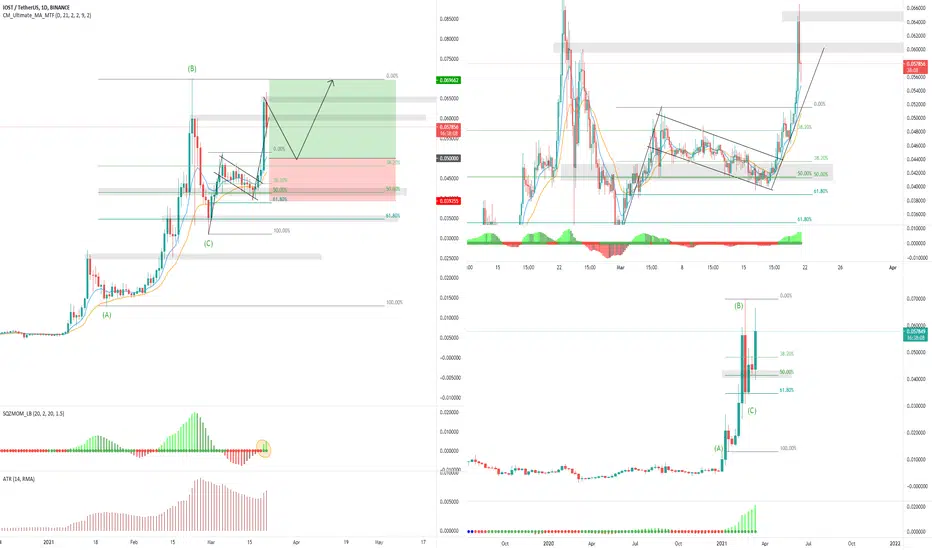
Price currently showing strong weekly bullish momentum since January 11th, after forming a high from the A-B impulse wave, before retracing to the 61.8% fibonacci level.
DAILY
After the weekly retracement to the 61.8% fibonacci levrel price began consolidating and formed a bullish flag pattern which began on the 5th of March until the 18th. Price finally broke resistance of the upper trend line and continue higher above the previous weekly high.
4HR
I have highlights onthe 4HR chart confluence between the weekly retracement and the daily retracement lining up with the 50% fibonacci retracement.
ENTRY
0.050000USDT
S.L
0.039255USDT
T.P
0.069662USDT
R:R
1:1.83
Price currently showing strong weekly bullish momentum since January 11th, after forming a high from the A-B impulse wave, before retracing to the 61.8% fibonacci level.
DAILY
After the weekly retracement to the 61.8% fibonacci levrel price began consolidating and formed a bullish flag pattern which began on the 5th of March until the 18th. Price finally broke resistance of the upper trend line and continue higher above the previous weekly high.
4HR
I have highlights onthe 4HR chart confluence between the weekly retracement and the daily retracement lining up with the 50% fibonacci retracement.
ENTRY
0.050000USDT
S.L
0.039255USDT
T.P
0.069662USDT
R:R
1:1.83

Declinazione di responsabilità
Le informazioni e le pubblicazioni non sono intese come, e non costituiscono, consulenza o raccomandazioni finanziarie, di investimento, di trading o di altro tipo fornite o approvate da TradingView. Per ulteriori informazioni, consultare i Termini di utilizzo.
Declinazione di responsabilità
Le informazioni e le pubblicazioni non sono intese come, e non costituiscono, consulenza o raccomandazioni finanziarie, di investimento, di trading o di altro tipo fornite o approvate da TradingView. Per ulteriori informazioni, consultare i Termini di utilizzo.