
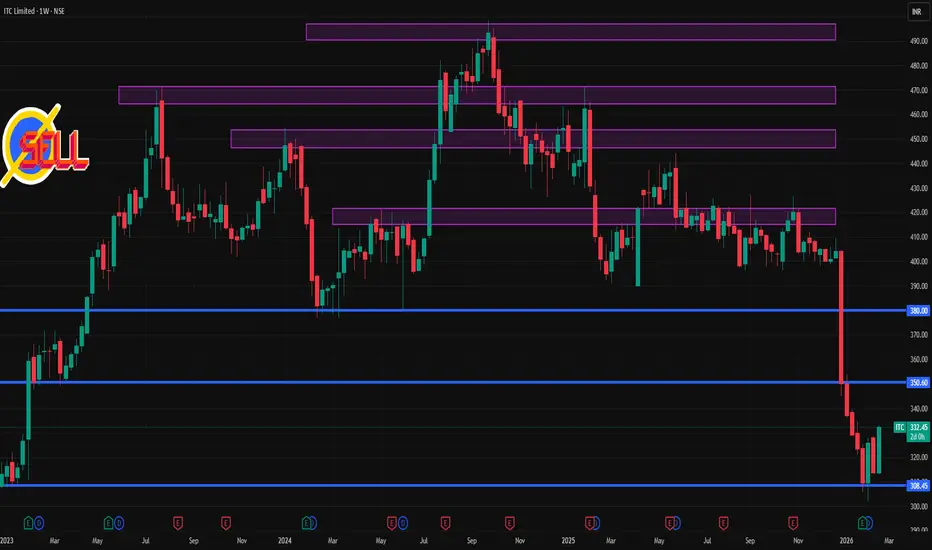
📍 Current Weekly Price
• The stock is trading around ₹331 – ₹335 on NSE/BSE at this point in the week.
📊 1-Week Timeframe — Key Levels (Weekly Pivot & Structures)
🔻 Weekly Support Levels
These are likely areas where buyers may step in this week if price weakens:
• Support 1: ~₹325 – ₹326 (near current range)
• Support 2: ~₹321 – ₹322
• Support 3: ~₹314 – ₹315 — deeper weekly support zone
(Support range based on weekly pivot band analysis on current price context)
🔺 Weekly Resistance Levels
Resistance levels where supply might cap upside this week:
• Immediate Resistance (R1): ~₹336 – ₹337
• R2: ~₹343 – ₹344
• R3: ~₹347 (upper weekly resistance)
(These are derived from pivot / weekly resistance bands)
📌 Weekly Pivot Reference
• Weekly Pivot (Reference): ~₹332 – ₹333
A weekly close above this suggests short-term bullish bias; below this suggests bearish structure.
📈 What This Means (Weekly Technical View)
🔹 Current trend context: The stock has been under pressure recently and is trading near the lower range of its 52-week price band (between ~₹302 low and ₹444 high).
🔹 Bearish bias this week: ITC trading below key moving averages and pivot points typically indicates short-term bearish control unless price breaks above the resistance levels noted above.
🔹 Bullish pivot levels: A weekly close above ~₹336-₹338 would suggest short-term relief and potential move toward higher resistance zones (₹343+).
🔹 Bearish break: A break & weekly close below ~₹325 strengthens downside momentum toward next supports near ₹321 / ₹314.

Contact Knowledgehub for a detailed consultation: Dm on WhatsApp: [wa.link/a2o0kz]-
Phone No: [+91 93102 26243]-
Email: [tradingviewknowledgehub@gmail.com]---
-- Let’s achieve success together!
Phone No: [+91 93102 26243]-
Email: [tradingviewknowledgehub@gmail.com]---
-- Let’s achieve success together!
Pubblicazioni correlate
Declinazione di responsabilità
Le informazioni e le pubblicazioni non sono intese come, e non costituiscono, consulenza o raccomandazioni finanziarie, di investimento, di trading o di altro tipo fornite o approvate da TradingView. Per ulteriori informazioni, consultare i Termini di utilizzo.