
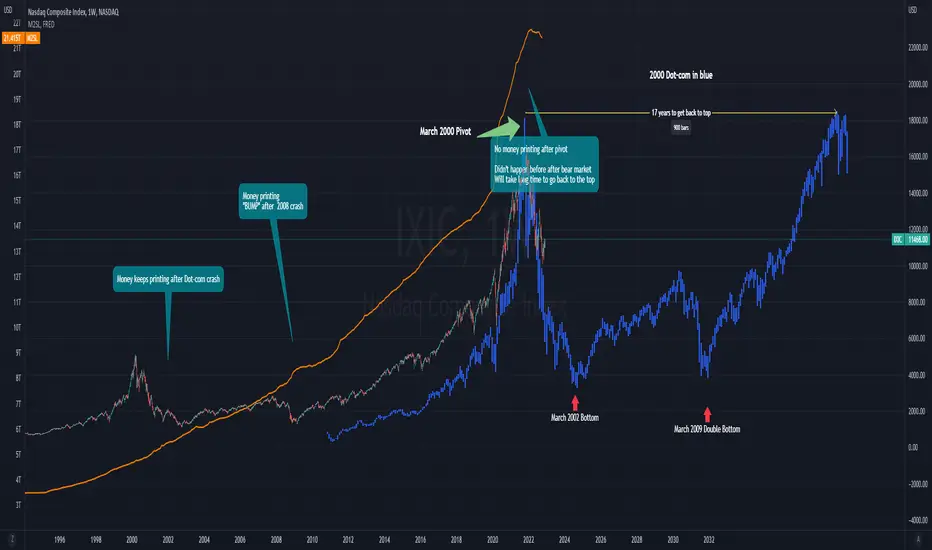
compared dot-com crisis to current crisis on the Nasdaq / QQQ
Orange line is the money printing graph from the fed- which had never stop printing money during crisis and this time- there's no more $$ printing for quite a while
Time will tell if history repeats it self
Orange line is the money printing graph from the fed- which had never stop printing money during crisis and this time- there's no more $$ printing for quite a while
Time will tell if history repeats it self

Declinazione di responsabilità
Le informazioni e le pubblicazioni non sono intese come, e non costituiscono, consulenza o raccomandazioni finanziarie, di investimento, di trading o di altro tipo fornite o approvate da TradingView. Per ulteriori informazioni, consultare i Termini di utilizzo.
Declinazione di responsabilità
Le informazioni e le pubblicazioni non sono intese come, e non costituiscono, consulenza o raccomandazioni finanziarie, di investimento, di trading o di altro tipo fornite o approvate da TradingView. Per ulteriori informazioni, consultare i Termini di utilizzo.