
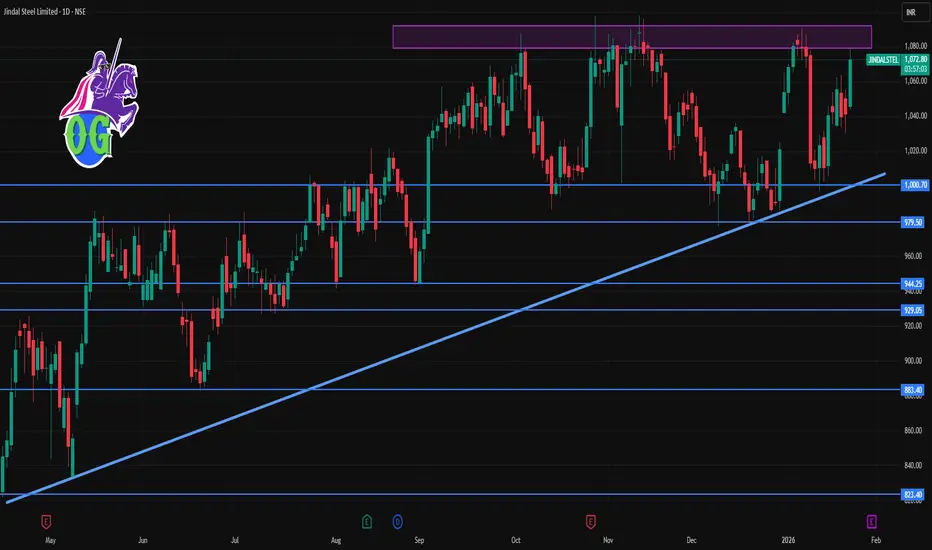
📊 Current Price Snapshot
The stock has been trading around ~₹1,030–₹1,070 on recent sessions.
🔑 Daily Pivot & Key Levels (1‑Day Time Frame)
🔼 Resistance Levels
R1: ~₹1,053–₹1,063
R2: ~₹1,062–₹1,071
R3: ~₹1,070–₹1,079+
These are potential daily resistance zones where price may slow or reverse on the upside.
🔁 Pivot/Reference Level
Daily Pivot (central level): ~₹1,045–₹1,046
This is the equilibrium reference; above this suggests slightly bullish bias, below suggests bearish bias for the day.
🔽 Support Levels
S1: ~₹1,034–₹1,056
S2: ~₹1,025–₹1,048
S3: ~₹1,015–₹1,041
These are key intraday support zones where the stock may find buying interest.
📈 How to Use These Levels Today
Bullish scenario: If price holds above the pivot and clears R1/R2 (~₹1,053–₹1,071) with volume, it may test R3 (~₹1,078+).
Bearish scenario: If it breaks below S2 (~₹1,025), watch for deeper pullbacks toward S3 (~₹1,015).
Range‑bound: If staying between pivot and S1/R1, expect sideways movement.
(Typical pivot logic — not investment advice.)
The stock has been trading around ~₹1,030–₹1,070 on recent sessions.
🔑 Daily Pivot & Key Levels (1‑Day Time Frame)
🔼 Resistance Levels
R1: ~₹1,053–₹1,063
R2: ~₹1,062–₹1,071
R3: ~₹1,070–₹1,079+
These are potential daily resistance zones where price may slow or reverse on the upside.
🔁 Pivot/Reference Level
Daily Pivot (central level): ~₹1,045–₹1,046
This is the equilibrium reference; above this suggests slightly bullish bias, below suggests bearish bias for the day.
🔽 Support Levels
S1: ~₹1,034–₹1,056
S2: ~₹1,025–₹1,048
S3: ~₹1,015–₹1,041
These are key intraday support zones where the stock may find buying interest.
📈 How to Use These Levels Today
Bullish scenario: If price holds above the pivot and clears R1/R2 (~₹1,053–₹1,071) with volume, it may test R3 (~₹1,078+).
Bearish scenario: If it breaks below S2 (~₹1,025), watch for deeper pullbacks toward S3 (~₹1,015).
Range‑bound: If staying between pivot and S1/R1, expect sideways movement.
(Typical pivot logic — not investment advice.)

Contact Knowledgehub for a detailed consultation: Dm on WhatsApp: [wa.link/a2o0kz]-
Phone No: [+91 93102 26243]-
Email: [tradingviewknowledgehub@gmail.com]---
-- Let’s achieve success together!
Phone No: [+91 93102 26243]-
Email: [tradingviewknowledgehub@gmail.com]---
-- Let’s achieve success together!
Pubblicazioni correlate
Declinazione di responsabilità
Le informazioni e le pubblicazioni non sono intese come, e non costituiscono, consulenza o raccomandazioni finanziarie, di investimento, di trading o di altro tipo fornite o approvate da TradingView. Per ulteriori informazioni, consultare i Termini di utilizzo.
Contact Knowledgehub for a detailed consultation: Dm on WhatsApp: [wa.link/a2o0kz]-
Phone No: [+91 93102 26243]-
Email: [tradingviewknowledgehub@gmail.com]---
-- Let’s achieve success together!
Phone No: [+91 93102 26243]-
Email: [tradingviewknowledgehub@gmail.com]---
-- Let’s achieve success together!
Pubblicazioni correlate
Declinazione di responsabilità
Le informazioni e le pubblicazioni non sono intese come, e non costituiscono, consulenza o raccomandazioni finanziarie, di investimento, di trading o di altro tipo fornite o approvate da TradingView. Per ulteriori informazioni, consultare i Termini di utilizzo.