What's up everyone, I'm back with some quick update on $JPM.
Quick fact: The 65-minute chart has 6 evenly sized candles (65 x 6 = 390, amt of mins per day).
Based on our previous analysis:
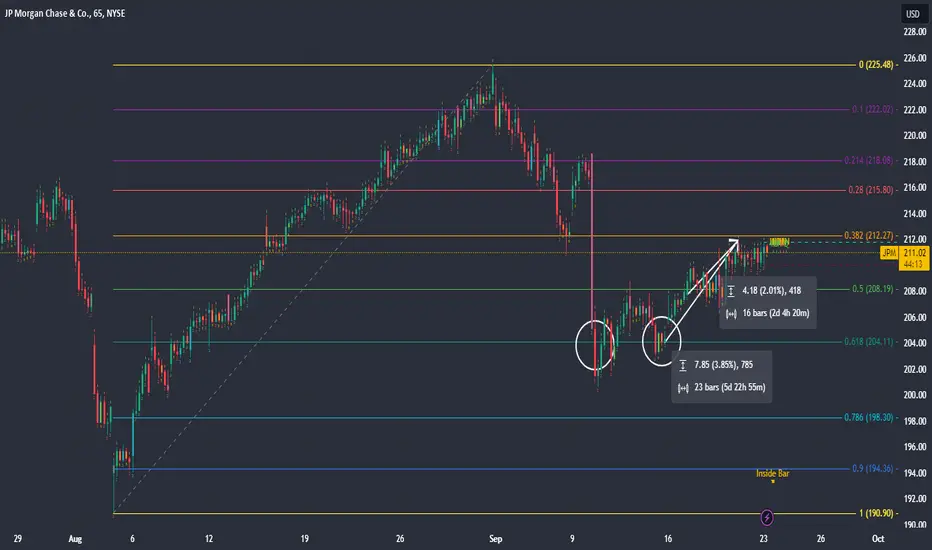
- JPM has bounced off the 0.618 bullish Fibonacci on the 65-minute chart at $204.11
- Price Target of $225.48 at 0.0 (assuming we continue the bullish trend)
- Stop Loss of $194.36 at the 0.9 bullish Fibonacci
The price is currently up 2% from when we first analyzed the stock and 3.85% from the last time it touched 0.618.
If you're in the play, stay the course, move your stop loss to 0.5 Fibonacci if you want to decrease your risk. If not, hold on.
I'm not in the play.
Quick fact: The 65-minute chart has 6 evenly sized candles (65 x 6 = 390, amt of mins per day).
Based on our previous analysis:
-
JPM has bounced off the 0.618 bullish Fibonacci on the 65-minute chart at $204.11- Price Target of $225.48 at 0.0 (assuming we continue the bullish trend)
- Stop Loss of $194.36 at the 0.9 bullish Fibonacci
The price is currently up 2% from when we first analyzed the stock and 3.85% from the last time it touched 0.618.
If you're in the play, stay the course, move your stop loss to 0.5 Fibonacci if you want to decrease your risk. If not, hold on.
I'm not in the play.

Pubblicazioni correlate
Declinazione di responsabilità
Le informazioni e le pubblicazioni non sono intese come, e non costituiscono, consulenza o raccomandazioni finanziarie, di investimento, di trading o di altro tipo fornite o approvate da TradingView. Per ulteriori informazioni, consultare i Termini di utilizzo.