
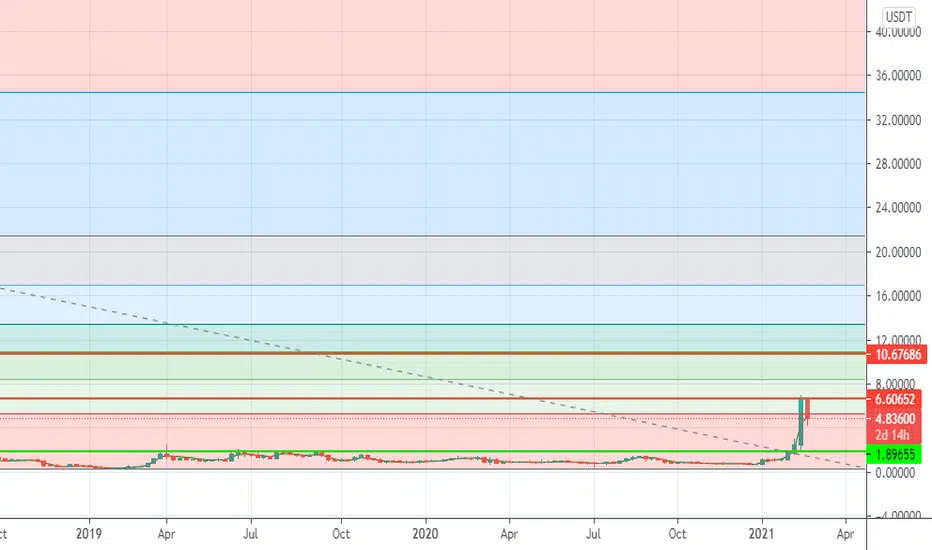
KCS broke a good support of $1.89 on the weekly graph in the first week of August 2018 and ever since it was struggling to break this support turned to resistance. It made various attempts to break this resistance in April, June, July, September and November 2019 but got rejected every time. Finally, in February, it broke this resistance of $1.89 and quickly jumped by over 300% in a week into the resistance of $6.60. If this resistance at $6.06 can be broken, we could start seeing a move towards the next fib and coinciding resistance at $10.88. Breaking this resistance could lead to a move towards the higher fibs at $13.37, $16.91, $21.43 and $34.47.

Declinazione di responsabilità
Le informazioni e le pubblicazioni non sono intese come, e non costituiscono, consulenza o raccomandazioni finanziarie, di investimento, di trading o di altro tipo fornite o approvate da TradingView. Per ulteriori informazioni, consultare i Termini di utilizzo.
Declinazione di responsabilità
Le informazioni e le pubblicazioni non sono intese come, e non costituiscono, consulenza o raccomandazioni finanziarie, di investimento, di trading o di altro tipo fornite o approvate da TradingView. Per ulteriori informazioni, consultare i Termini di utilizzo.