
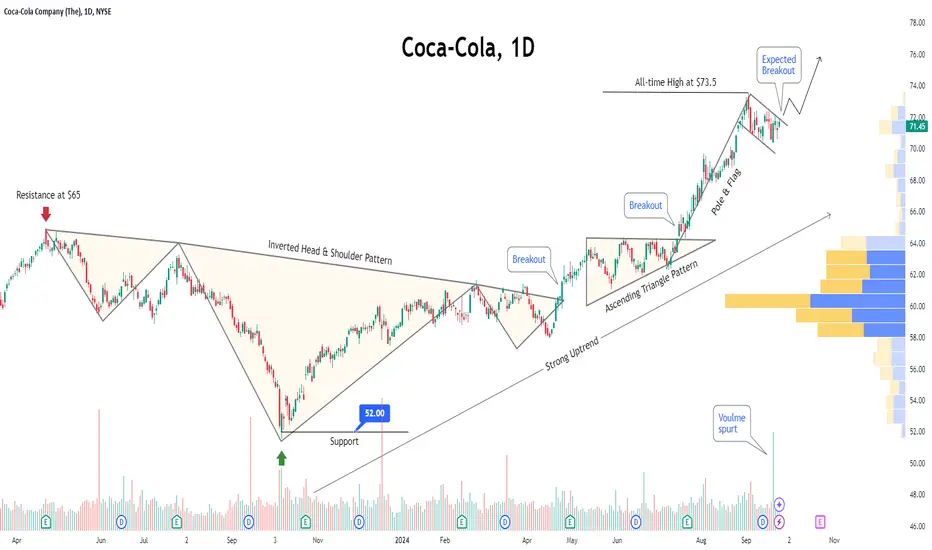
- The chart shows that the stock price encountered resistance near the $65 level, subsequently dropping to $52, where it found support.
- After rebounding from this support, the price began to rise, successfully breaking through the Inverted Head & Shoulders pattern that had formed during the consolidation phase.
- Following this breakout, the price entered another consolidation period, created an Ascending Triangle Pattern.
- With another breakout, the stock price surged to an all-time high of $73.5 before experiencing a pullback.
- A bullish Pole & Flag pattern has emerged on the chart, signaling a potential continuation of the upward trend.
- It is expected that the price will break through this pattern and reach new highs in the near future.

🌐 naranjcapital.com
🎖️ CMT (usa) & CFTe (usa) chartered
🇺🇸 Telegram - USA Stocks Trading Advice
t.me/Naranj_USA
🇸🇦 Telegram - Saudi Stocks Trading Advice
t.me/Naranj_KSA
🤝 Contact Us
bio.link/NaranjCapital
🎖️ CMT (usa) & CFTe (usa) chartered
🇺🇸 Telegram - USA Stocks Trading Advice
t.me/Naranj_USA
🇸🇦 Telegram - Saudi Stocks Trading Advice
t.me/Naranj_KSA
🤝 Contact Us
bio.link/NaranjCapital
Pubblicazioni correlate
Declinazione di responsabilità
Le informazioni e le pubblicazioni non sono intese come, e non costituiscono, consulenza o raccomandazioni finanziarie, di investimento, di trading o di altro tipo fornite o approvate da TradingView. Per ulteriori informazioni, consultare i Termini di utilizzo.
🌐 naranjcapital.com
🎖️ CMT (usa) & CFTe (usa) chartered
🇺🇸 Telegram - USA Stocks Trading Advice
t.me/Naranj_USA
🇸🇦 Telegram - Saudi Stocks Trading Advice
t.me/Naranj_KSA
🤝 Contact Us
bio.link/NaranjCapital
🎖️ CMT (usa) & CFTe (usa) chartered
🇺🇸 Telegram - USA Stocks Trading Advice
t.me/Naranj_USA
🇸🇦 Telegram - Saudi Stocks Trading Advice
t.me/Naranj_KSA
🤝 Contact Us
bio.link/NaranjCapital
Pubblicazioni correlate
Declinazione di responsabilità
Le informazioni e le pubblicazioni non sono intese come, e non costituiscono, consulenza o raccomandazioni finanziarie, di investimento, di trading o di altro tipo fornite o approvate da TradingView. Per ulteriori informazioni, consultare i Termini di utilizzo.