
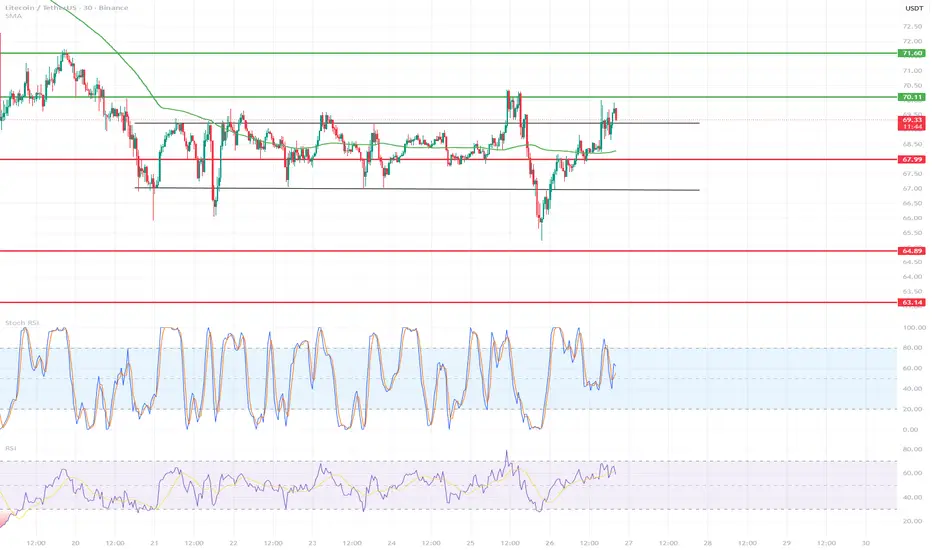
📊 1) Market Structure (Price Action)
The market is consolidating/accumulating between ~67.2 and ~70.1.
Previously, there was a strong decline, then range trading with false breakouts.
Currently, the price has rebounded from the ~66 low and is making a higher low → short-term bullish.
👉 This looks like a retest of the range bottom → a push to the middle of the range.
🧱 2) Key Levels (Your lines are well marked)
🔴 Support Levels
67.20 – the most important local support (range low).
64.89 – a strong swing low (if 67 breaks → decline here).
63.14 – the bulls' last defense.
🟢 Resistance
69.37 – mid-range, local S/R flip.
70.11 – key range high.
71.60 – strong HTF resistance (if it breaks 70 → target).
📈 3) Trend (moving average)
The green MA (probably the 200 EMA/SMA) has been acting as dynamic resistance previously, and now the price is starting to hold above it → bullish short-term.
Structure:
low → higher low → test resistance = breakout potential.
⚡ 4) RSI + Stoch RSI
RSI (lower panel)
RSI ~55–60 → bullish momentum (above 50).
No overbought → room for further upward movement.
Stoch RSI (middle panel)
Oscillates, but not to an extreme → no dump signal.
If it crosses upwards >80 → a scalp short signal (at 30m).
🧠 5) Scenarios (most important)
🟢 BULLISH SCENARIO
Condition:
Close of the 30m candle above 69.40
Targets:
70.11
71.60
73+ (if a breakout range on HTF)
👉 This will be a consolidation breakout → an impulsive move.
🔴 BEARISH SCENARIO
Condition:
Rejection of 69.4 + return to below 67.9
Targets:
67.20
64.89
63.14
👉 This will be a classic range fake breakout → dump to the lower zone.
🧨 6) What do I see as smart money?
A liquidity grab above 69.5–70 is very likely, followed by a dump.
Market makers like to:
break resistance
collect longs
dump to range low
💰 7) Trading setup (pro)
📌 LONG scalp
Entry: 69.4 breakout retest
SL: 68.8
TP1: 70.1
TP2: 71.6
📌 SHORT swing (better R:R)
Entry: 70–71 rejection
SL: 71.8
TP1: 67.2
TP2: 64.9
The market is consolidating/accumulating between ~67.2 and ~70.1.
Previously, there was a strong decline, then range trading with false breakouts.
Currently, the price has rebounded from the ~66 low and is making a higher low → short-term bullish.
👉 This looks like a retest of the range bottom → a push to the middle of the range.
🧱 2) Key Levels (Your lines are well marked)
🔴 Support Levels
67.20 – the most important local support (range low).
64.89 – a strong swing low (if 67 breaks → decline here).
63.14 – the bulls' last defense.
🟢 Resistance
69.37 – mid-range, local S/R flip.
70.11 – key range high.
71.60 – strong HTF resistance (if it breaks 70 → target).
📈 3) Trend (moving average)
The green MA (probably the 200 EMA/SMA) has been acting as dynamic resistance previously, and now the price is starting to hold above it → bullish short-term.
Structure:
low → higher low → test resistance = breakout potential.
⚡ 4) RSI + Stoch RSI
RSI (lower panel)
RSI ~55–60 → bullish momentum (above 50).
No overbought → room for further upward movement.
Stoch RSI (middle panel)
Oscillates, but not to an extreme → no dump signal.
If it crosses upwards >80 → a scalp short signal (at 30m).
🧠 5) Scenarios (most important)
🟢 BULLISH SCENARIO
Condition:
Close of the 30m candle above 69.40
Targets:
70.11
71.60
73+ (if a breakout range on HTF)
👉 This will be a consolidation breakout → an impulsive move.
🔴 BEARISH SCENARIO
Condition:
Rejection of 69.4 + return to below 67.9
Targets:
67.20
64.89
63.14
👉 This will be a classic range fake breakout → dump to the lower zone.
🧨 6) What do I see as smart money?
A liquidity grab above 69.5–70 is very likely, followed by a dump.
Market makers like to:
break resistance
collect longs
dump to range low
💰 7) Trading setup (pro)
📌 LONG scalp
Entry: 69.4 breakout retest
SL: 68.8
TP1: 70.1
TP2: 71.6
📌 SHORT swing (better R:R)
Entry: 70–71 rejection
SL: 71.8
TP1: 67.2
TP2: 64.9

Declinazione di responsabilità
Le informazioni e le pubblicazioni non sono intese come, e non costituiscono, consulenza o raccomandazioni finanziarie, di investimento, di trading o di altro tipo fornite o approvate da TradingView. Per ulteriori informazioni, consultare i Termini di utilizzo.
Declinazione di responsabilità
Le informazioni e le pubblicazioni non sono intese come, e non costituiscono, consulenza o raccomandazioni finanziarie, di investimento, di trading o di altro tipo fornite o approvate da TradingView. Per ulteriori informazioni, consultare i Termini di utilizzo.