
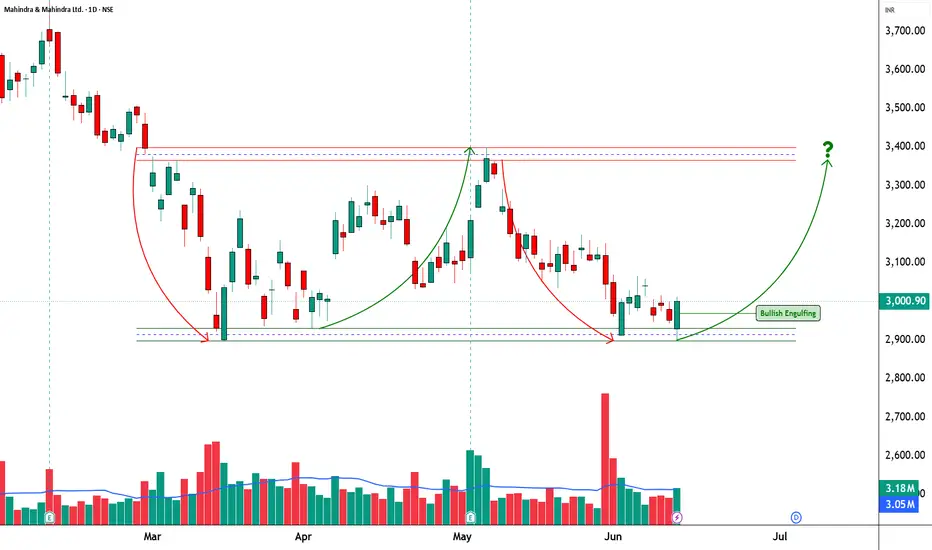
Mahindra & Mahindra Swing Setup: Bullish Reversal Pattern Challenges Negative Production Narrative
________________________________________
Mahindra & Mahindra Ltd. (NSE: M&M)
Technical Research Report | Daily Timeframe
Current Price: ₹3,001.00 (+1.64%)
Volume: 3.18 Million Shares
Pattern: Bullish Engulfing
Pattern Reliability: 79.0%
Trend Status: Weakening Downtrend
Setup Classification: Multi-Day Swing Setup
________________________________________
1. Fundamental Disconnect vs. Structural Shift
Mahindra & Mahindra currently presents an interesting divergence between short-term fundamental sentiment and emerging technical behaviour.
Recent reports indicating a 15% decline in June SUV production due to supply-chain labour shortages have naturally introduced near-term concerns regarding operational efficiency and production throughput. From a fundamental perspective, such developments often create uncertainty regarding delivery schedules, inventory planning, and near-term earnings expectations.
However, markets frequently discount information before it becomes visible in reported numbers. As a result, the more important question becomes whether market participants are using the news as a reason to distribute holdings or as an opportunity to accumulate positions at attractive structural levels.
The current chart suggests the latter possibility.
Despite the negative news flow, M&M generated a Bullish Engulfing pattern with a reliability score of 79.0%, while simultaneously attracting 3.18 million shares of volume, reflecting above-average participation and visible buying dominance.
From an institutional market structure perspective, this behaviour is noteworthy because the reversal signal is occurring near the lower boundary of a multi-month trading range.
The market is effectively communicating three important observations:
Negative news has not produced a structural breakdown.
Buyers continue to defend the lower range region.
Price is attempting stabilization despite weakening sentiment.
This creates what technicians often refer to as a fundamental disconnect, where headline news remains negative while price behaviour begins showing signs of stabilization.
The significance of the Bullish Engulfing pattern increases because it appears within a Lower Range Consolidation environment, where downside momentum is already showing signs of exhaustion.
While the broader trend remains technically weak, the current setup suggests that institutional participants may be selectively accumulating exposure while market sentiment remains cautious.
________________________________________
2. Multi-Day Swing Architecture
The current swing framework revolves around the Reference Entry Zone at ₹3,128.15.
This level represents the primary technical decision area for the ongoing recovery attempt.
At present, the stock remains below the reference zone, indicating that the reversal signal has emerged but has not yet transitioned into full confirmation. The objective for bulls is not merely to sustain the Bullish Engulfing pattern but to establish acceptance above the reference area.
Reference Entry Zone
₹3,128.15
A sustained move toward and above this level would signal improving market acceptance and strengthen the probability that the current recovery extends beyond a short-term reaction.
________________________________________
First Objective
Resistance 1 (R1): ₹3,041.93
This represents the nearest supply zone and the first technical hurdle within the recovery process.
________________________________________
Secondary Objective
Resistance 2 (R2): ₹3,082.97
A move through this region would indicate increasing buyer commitment and continued structural repair.
________________________________________
Primary Swing Objective
Resistance 3 (R3): ₹3,153.73
This level carries elevated significance because it sits slightly above the reference framework and would demonstrate that the market is successfully overcoming recent supply pressure.
________________________________________
Macro Structural Objective
Higher Range: ₹3,399.00
The broader technical ceiling remains located near ₹3,399.00.
A successful progression toward this zone would represent a substantial improvement in structure and would effectively signal a transition from recovery into trend restoration.
From a technical perspective, the journey from the current lower-range environment toward ₹3,399 would require multiple layers of confirmation, including improving momentum indicators and sustained participation.
________________________________________
3. Risk Mitigation & Support Grids
Although the Bullish Engulfing pattern provides a constructive signal, risk management remains essential because several momentum indicators continue to show caution.
Current indicator conditions include:
RSI: 43.92 (below neutral equilibrium)
MACD: -46.98 (bearish momentum remains present)
Bollinger Bands: Compression phase (BB Squeeze)
Trend Structure: Weakening Downtrend
Market State: Lower Range Consolidation
These conditions suggest that the market is attempting stabilization but has not yet completed a full trend reversal.
________________________________________
Support Infrastructure
Support 1
₹2,930.13
The nearest support level and the first area expected to attract buyers during any pullback.
Support 2
₹2,859.37
A more significant support zone that would become relevant if the recovery loses momentum.
Support 3
₹2,818.33
The final major structural support visible within the current framework.
Lower Range
₹2,900.40
This level represents the broader accumulation zone currently supporting price.
________________________________________
Technical Invalidation
Stop Loss
₹2,919.25
This level serves as the primary technical invalidation point for the current swing setup.
A decisive breakdown below this level would indicate that the lower-range accumulation thesis is failing and that sellers have regained control of the market structure.
________________________________________
Position Sizing & Risk Profile
The current setup carries a defined risk of:
₹115.10 per share
This is a relatively wide risk parameter and therefore requires disciplined capital allocation.
Professional traders typically adjust position size according to predefined risk exposure rather than increasing exposure based solely on conviction. The wider the stop distance, the smaller the position size required to maintain consistent portfolio risk.
The presence of a Bollinger Band Squeeze adds another layer of importance to risk management.
Compression environments often precede volatility expansion. While the eventual expansion may occur in favour of the reversal pattern, technicians must acknowledge that compressed markets can produce sharp directional moves in either direction.
As a result, maintaining strict adherence to predefined invalidation levels remains critical.
________________________________________
Technical Conclusion
Mahindra & Mahindra currently represents a compelling example of technical behaviour diverging from short-term fundamental sentiment.
While recent production disruptions and labour-related supply constraints have introduced negative headlines, price action has thus far resisted a broader breakdown. Instead, the stock has formed a Bullish Engulfing pattern with 79.0% reliability, supported by 3.18 million shares of volume and visible buying dominance.
The market remains within a weakening downtrend and several momentum indicators continue to require improvement. However, the combination of lower-range stabilization, expanding participation, and Bollinger Band compression suggests that the stock may be entering an important structural inflection phase.
The immediate focus remains on the progression toward the ₹3,128.15 reference zone, while the broader technical framework continues to monitor the pathway through ₹3,041.93, ₹3,082.97, and ₹3,153.73, ultimately extending toward the higher-range ceiling at ₹3,399.00.
Until additional confirmation emerges, the setup should be viewed as a developing recovery attempt supported by improving participation rather than a fully established trend reversal.
________________________________________
Educational Disclaimer
This analysis is provided solely for educational and informational purposes and reflects a technical interpretation of price action, market structure, volume behaviour, and publicly known developments. It does not constitute investment advice, a recommendation, or a solicitation to buy or sell any financial instrument. Market conditions can change rapidly, and technical patterns do not guarantee future outcomes. Investors and traders should conduct their own independent research and consult a SEBI-registered investment advisor before making any investment or trading decisions.
________________________________________
Mahindra & Mahindra Ltd. (NSE: M&M)
Technical Research Report | Daily Timeframe
Current Price: ₹3,001.00 (+1.64%)
Volume: 3.18 Million Shares
Pattern: Bullish Engulfing
Pattern Reliability: 79.0%
Trend Status: Weakening Downtrend
Setup Classification: Multi-Day Swing Setup
________________________________________
1. Fundamental Disconnect vs. Structural Shift
Mahindra & Mahindra currently presents an interesting divergence between short-term fundamental sentiment and emerging technical behaviour.
Recent reports indicating a 15% decline in June SUV production due to supply-chain labour shortages have naturally introduced near-term concerns regarding operational efficiency and production throughput. From a fundamental perspective, such developments often create uncertainty regarding delivery schedules, inventory planning, and near-term earnings expectations.
However, markets frequently discount information before it becomes visible in reported numbers. As a result, the more important question becomes whether market participants are using the news as a reason to distribute holdings or as an opportunity to accumulate positions at attractive structural levels.
The current chart suggests the latter possibility.
Despite the negative news flow, M&M generated a Bullish Engulfing pattern with a reliability score of 79.0%, while simultaneously attracting 3.18 million shares of volume, reflecting above-average participation and visible buying dominance.
From an institutional market structure perspective, this behaviour is noteworthy because the reversal signal is occurring near the lower boundary of a multi-month trading range.
The market is effectively communicating three important observations:
Negative news has not produced a structural breakdown.
Buyers continue to defend the lower range region.
Price is attempting stabilization despite weakening sentiment.
This creates what technicians often refer to as a fundamental disconnect, where headline news remains negative while price behaviour begins showing signs of stabilization.
The significance of the Bullish Engulfing pattern increases because it appears within a Lower Range Consolidation environment, where downside momentum is already showing signs of exhaustion.
While the broader trend remains technically weak, the current setup suggests that institutional participants may be selectively accumulating exposure while market sentiment remains cautious.
________________________________________
2. Multi-Day Swing Architecture
The current swing framework revolves around the Reference Entry Zone at ₹3,128.15.
This level represents the primary technical decision area for the ongoing recovery attempt.
At present, the stock remains below the reference zone, indicating that the reversal signal has emerged but has not yet transitioned into full confirmation. The objective for bulls is not merely to sustain the Bullish Engulfing pattern but to establish acceptance above the reference area.
Reference Entry Zone
₹3,128.15
A sustained move toward and above this level would signal improving market acceptance and strengthen the probability that the current recovery extends beyond a short-term reaction.
________________________________________
First Objective
Resistance 1 (R1): ₹3,041.93
This represents the nearest supply zone and the first technical hurdle within the recovery process.
________________________________________
Secondary Objective
Resistance 2 (R2): ₹3,082.97
A move through this region would indicate increasing buyer commitment and continued structural repair.
________________________________________
Primary Swing Objective
Resistance 3 (R3): ₹3,153.73
This level carries elevated significance because it sits slightly above the reference framework and would demonstrate that the market is successfully overcoming recent supply pressure.
________________________________________
Macro Structural Objective
Higher Range: ₹3,399.00
The broader technical ceiling remains located near ₹3,399.00.
A successful progression toward this zone would represent a substantial improvement in structure and would effectively signal a transition from recovery into trend restoration.
From a technical perspective, the journey from the current lower-range environment toward ₹3,399 would require multiple layers of confirmation, including improving momentum indicators and sustained participation.
________________________________________
3. Risk Mitigation & Support Grids
Although the Bullish Engulfing pattern provides a constructive signal, risk management remains essential because several momentum indicators continue to show caution.
Current indicator conditions include:
RSI: 43.92 (below neutral equilibrium)
MACD: -46.98 (bearish momentum remains present)
Bollinger Bands: Compression phase (BB Squeeze)
Trend Structure: Weakening Downtrend
Market State: Lower Range Consolidation
These conditions suggest that the market is attempting stabilization but has not yet completed a full trend reversal.
________________________________________
Support Infrastructure
Support 1
₹2,930.13
The nearest support level and the first area expected to attract buyers during any pullback.
Support 2
₹2,859.37
A more significant support zone that would become relevant if the recovery loses momentum.
Support 3
₹2,818.33
The final major structural support visible within the current framework.
Lower Range
₹2,900.40
This level represents the broader accumulation zone currently supporting price.
________________________________________
Technical Invalidation
Stop Loss
₹2,919.25
This level serves as the primary technical invalidation point for the current swing setup.
A decisive breakdown below this level would indicate that the lower-range accumulation thesis is failing and that sellers have regained control of the market structure.
________________________________________
Position Sizing & Risk Profile
The current setup carries a defined risk of:
₹115.10 per share
This is a relatively wide risk parameter and therefore requires disciplined capital allocation.
Professional traders typically adjust position size according to predefined risk exposure rather than increasing exposure based solely on conviction. The wider the stop distance, the smaller the position size required to maintain consistent portfolio risk.
The presence of a Bollinger Band Squeeze adds another layer of importance to risk management.
Compression environments often precede volatility expansion. While the eventual expansion may occur in favour of the reversal pattern, technicians must acknowledge that compressed markets can produce sharp directional moves in either direction.
As a result, maintaining strict adherence to predefined invalidation levels remains critical.
________________________________________
Technical Conclusion
Mahindra & Mahindra currently represents a compelling example of technical behaviour diverging from short-term fundamental sentiment.
While recent production disruptions and labour-related supply constraints have introduced negative headlines, price action has thus far resisted a broader breakdown. Instead, the stock has formed a Bullish Engulfing pattern with 79.0% reliability, supported by 3.18 million shares of volume and visible buying dominance.
The market remains within a weakening downtrend and several momentum indicators continue to require improvement. However, the combination of lower-range stabilization, expanding participation, and Bollinger Band compression suggests that the stock may be entering an important structural inflection phase.
The immediate focus remains on the progression toward the ₹3,128.15 reference zone, while the broader technical framework continues to monitor the pathway through ₹3,041.93, ₹3,082.97, and ₹3,153.73, ultimately extending toward the higher-range ceiling at ₹3,399.00.
Until additional confirmation emerges, the setup should be viewed as a developing recovery attempt supported by improving participation rather than a fully established trend reversal.
________________________________________
Educational Disclaimer
This analysis is provided solely for educational and informational purposes and reflects a technical interpretation of price action, market structure, volume behaviour, and publicly known developments. It does not constitute investment advice, a recommendation, or a solicitation to buy or sell any financial instrument. Market conditions can change rapidly, and technical patterns do not guarantee future outcomes. Investors and traders should conduct their own independent research and consult a SEBI-registered investment advisor before making any investment or trading decisions.

STWP | Mentor & Demand-Supply Specialist |
Empowering traders through structured learning |
simpletradewithpatience.com
chat.whatsapp.com/CpgyHCfioQ5Hxf7rd8pDqw
wa.me/message/6IOPHGOXMGZ4N1
Educational Only
Empowering traders through structured learning |
simpletradewithpatience.com
chat.whatsapp.com/CpgyHCfioQ5Hxf7rd8pDqw
wa.me/message/6IOPHGOXMGZ4N1
Educational Only
Declinazione di responsabilità
Le informazioni e le pubblicazioni non sono intese come, e non costituiscono, consulenza o raccomandazioni finanziarie, di investimento, di trading o di altro tipo fornite o approvate da TradingView. Per ulteriori informazioni, consultare i Termini di utilizzo.