
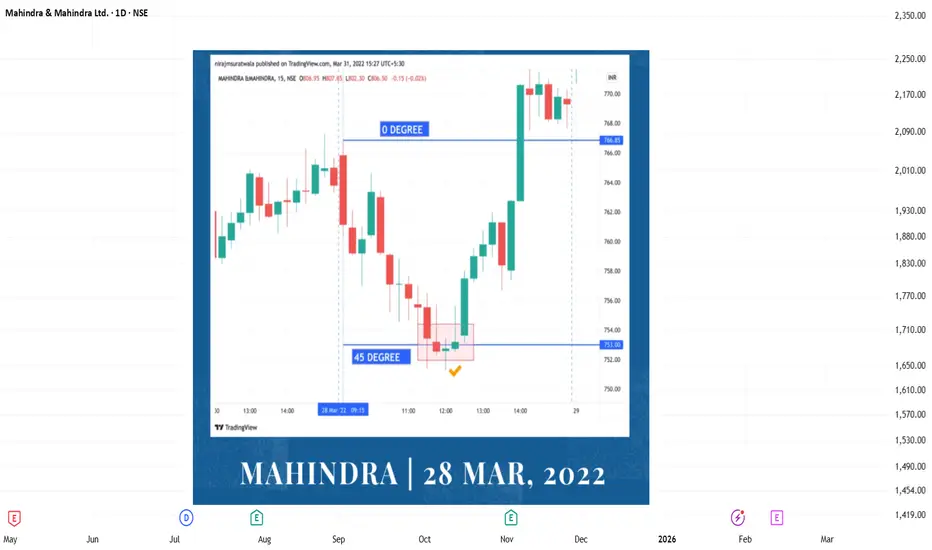
This idea presents a historical intraday case study demonstrating how the Gann Square of 9 helps identify measured reaction levels using price geometry.
On 28 March 2022, Mahindra & Mahindra Ltd showed a structured intraday move. The intraday high near ₹766.85 was treated as the 0° reference point as per the Gann Square of 9 methodology.
📐 Gann Degree Projections
0° (Base Reference): ₹766.85
45° (Normal Intraday Capacity): ₹753
90° (Extended Move Zone): ₹739
⏱️ Price–Time Behavior
Price declined steadily from the 0° level and completed the 45° distance (₹753) well within the trading session.
From this level, the stock reacted strongly upward, producing a clean intraday reversal.
As observed in classical Gann studies:
45° levels often act as dynamic support when achieved during normal intraday time
Such reactions frequently lead to directional continuation from equilibrium zones
🧠 Key Learning
This example highlights that:
Gann degree levels define logical price limits
Reversals occur at mathematically derived zones
Discipline comes from waiting for price + time alignment
📌 Conclusion
The Gann Square of 9 transforms market volatility into measurable structure.
Instead of prediction, it focuses on reaction and confirmation, helping traders stay objective and rule-based.
Disclaimer:
This idea is shared for educational and analytical purposes only. It is not a trading recommendation or investment advice.
On 28 March 2022, Mahindra & Mahindra Ltd showed a structured intraday move. The intraday high near ₹766.85 was treated as the 0° reference point as per the Gann Square of 9 methodology.
📐 Gann Degree Projections
0° (Base Reference): ₹766.85
45° (Normal Intraday Capacity): ₹753
90° (Extended Move Zone): ₹739
⏱️ Price–Time Behavior
Price declined steadily from the 0° level and completed the 45° distance (₹753) well within the trading session.
From this level, the stock reacted strongly upward, producing a clean intraday reversal.
As observed in classical Gann studies:
45° levels often act as dynamic support when achieved during normal intraday time
Such reactions frequently lead to directional continuation from equilibrium zones
🧠 Key Learning
This example highlights that:
Gann degree levels define logical price limits
Reversals occur at mathematically derived zones
Discipline comes from waiting for price + time alignment
📌 Conclusion
The Gann Square of 9 transforms market volatility into measurable structure.
Instead of prediction, it focuses on reaction and confirmation, helping traders stay objective and rule-based.
Disclaimer:
This idea is shared for educational and analytical purposes only. It is not a trading recommendation or investment advice.

Pubblicazioni correlate
Declinazione di responsabilità
Le informazioni e le pubblicazioni non sono intese come, e non costituiscono, consulenza o raccomandazioni finanziarie, di investimento, di trading o di altro tipo fornite o approvate da TradingView. Per ulteriori informazioni, consultare i Termini di utilizzo.
Pubblicazioni correlate
Declinazione di responsabilità
Le informazioni e le pubblicazioni non sono intese come, e non costituiscono, consulenza o raccomandazioni finanziarie, di investimento, di trading o di altro tipo fornite o approvate da TradingView. Per ulteriori informazioni, consultare i Termini di utilizzo.