
European Insurers: Yield Half That of Banks in a Low-Interest Environment
By Ion Jauregui – Analyst at ActivTrades
The European insurance sector has shown remarkable resilience over the past three years, initially benefiting from the European Central Bank’s (ECB) interest rate hikes and maintaining solid performance despite rates declining over the past year. Since the start of the monetary tightening cycle in July 2022, insurers have gained 64% in the stock market, half the advance seen in banks (+125%), yet significantly outperforming the Stoxx 600 (+20%). The EuroStoxx50, the benchmark index of major Eurozone companies, has posted a positive performance in 2025 with a year-to-date return of 13.65%, reflecting a solid recovery in the European market. This performance has been driven by sectors such as technology, healthcare, finance, and industrials, which have reported earnings growth exceeding expectations.
Banks Riding High, Insurers Lagging Behind
According to the latest Refinitiv/Euro Stoxx Banks data for 2025, the average PER of the European banking sector stands at around 9.8x, while the 10-year historical average PER has been approximately 8.2x. Thus, the European banking sector currently trades at a 19.5% premium to its historical average.
For the European insurance sector, the current average PER is around 12x, compared to a 10-year historical average of approximately 9x. Insurers are currently trading at a premium slightly above 33% relative to banks, a historically narrower gap than in the past, when it exceeded 80%. This adjustment reflects both earnings growth and a solid dividend policy, maintaining the sector’s attractiveness amid economic slowdown.
The life and health business has been key to the sector’s rebound, with revenue growth of 12.2% through June, according to Unespa and Icea data. Mapfre Economics estimates the insurance gap in Spain at around €41.4 billion, pointing to significant expansion potential. Across Europe, major players such as Allianz (+17%), Axa (+18%), and Zurich (+5%) ended the first half positively, while companies like Prudential (+50%), Aviva (+38%), and Admiral (+30%) posted remarkable gains.
Mapfre: Technical Strength and Relative Attractiveness
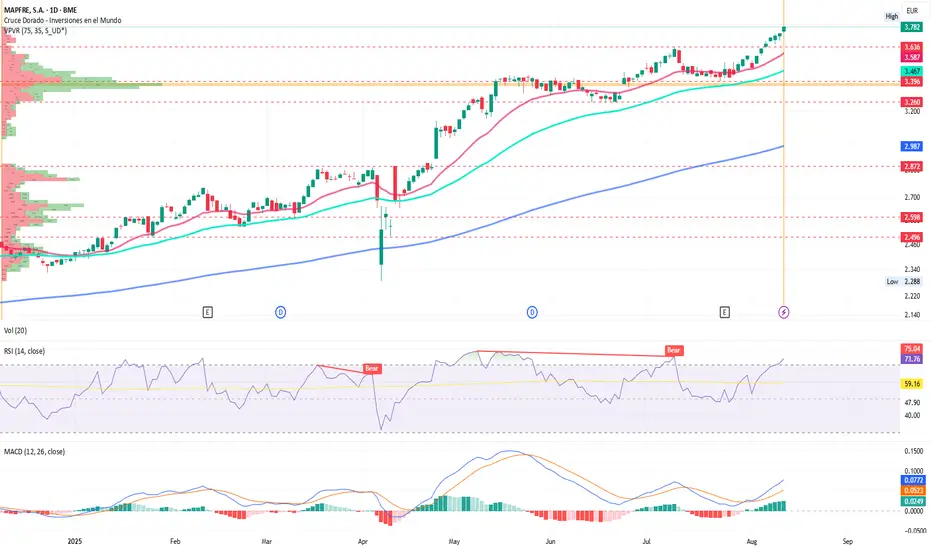
Mapfre stands out among peers due to its strong stock recovery (+almost 50% in 2025) and attractive valuation, with a PER below 10 compared to the sector average of 12. From a technical perspective, the stock trades at €3.78, consolidating above a key support zone at €3.63–3.70. A break above resistance at €3.80 could open a path toward the €4.00–4.05 zone, previous highs from 2018, while a drop below €3.65 would risk a correction toward €3.50. Key support levels are located around €3.63, the second support above the point of control (POC) at €3.396, and the third support at the lower end of the current accumulation area at €3.260. The RSI is currently highly overbought at 73.76%, and the MACD remains strongly bullish, supported by increasing histogram volume.
Strong claims performance, an improved combined ratio, and a ROE of 12.2% support the trend, while a dividend yield above 6% enhances its appeal for defensive investors.
Sector / Company Current PER Historical Avg. PER Premium (%) Performance 2025 YTD*
Mapfre 9,8x 9x 9% +48%
European Insurers 12x 9x 33% +14%
European Banks 9,8x 8,2x 19,5% +20%
Eurostoxx50 18x 16x 12,5% +8%
Stoxx600 15x 14x 7% +6%
*Performance as of August 2025. Ion Jauregui (2025)
Key Takeaways
• Mapfre stands out within the insurance sector, with a PER below the European average and a notable 48% gain year-to-date in 2025.
• This highlights that, despite the sector’s overall premium, Mapfre remains an attractive stock due to its growth potential and dividend.
• Comparing with EuroStoxx50, Stoxx600, and banks shows that the financial sector has led European market gains, though with significant differences between banks and insurers.
*******************************************************************************************
The information provided does not constitute investment research. The material has not been prepared in accordance with the legal requirements designed to promote the independence of investment research and such should be considered a marketing communication.
All information has been prepared by ActivTrades ("AT"). The information does not contain a record of AT's prices, or an offer of or solicitation for a transaction in any financial instrument. No representation or warranty is given as to the accuracy or completeness of this information.
Any material provided does not have regard to the specific investment objective and financial situation of any person who may receive it. Past performance and forecasting are not a synonym of a reliable indicator of future performance. AT provides an execution-only service. Consequently, any person acting on the information provided does so at their own risk. Political risk is unpredictable. Central bank actions can vary. Platform tools do not guarantee success.
By Ion Jauregui – Analyst at ActivTrades
The European insurance sector has shown remarkable resilience over the past three years, initially benefiting from the European Central Bank’s (ECB) interest rate hikes and maintaining solid performance despite rates declining over the past year. Since the start of the monetary tightening cycle in July 2022, insurers have gained 64% in the stock market, half the advance seen in banks (+125%), yet significantly outperforming the Stoxx 600 (+20%). The EuroStoxx50, the benchmark index of major Eurozone companies, has posted a positive performance in 2025 with a year-to-date return of 13.65%, reflecting a solid recovery in the European market. This performance has been driven by sectors such as technology, healthcare, finance, and industrials, which have reported earnings growth exceeding expectations.
Banks Riding High, Insurers Lagging Behind
According to the latest Refinitiv/Euro Stoxx Banks data for 2025, the average PER of the European banking sector stands at around 9.8x, while the 10-year historical average PER has been approximately 8.2x. Thus, the European banking sector currently trades at a 19.5% premium to its historical average.
For the European insurance sector, the current average PER is around 12x, compared to a 10-year historical average of approximately 9x. Insurers are currently trading at a premium slightly above 33% relative to banks, a historically narrower gap than in the past, when it exceeded 80%. This adjustment reflects both earnings growth and a solid dividend policy, maintaining the sector’s attractiveness amid economic slowdown.
The life and health business has been key to the sector’s rebound, with revenue growth of 12.2% through June, according to Unespa and Icea data. Mapfre Economics estimates the insurance gap in Spain at around €41.4 billion, pointing to significant expansion potential. Across Europe, major players such as Allianz (+17%), Axa (+18%), and Zurich (+5%) ended the first half positively, while companies like Prudential (+50%), Aviva (+38%), and Admiral (+30%) posted remarkable gains.
Mapfre: Technical Strength and Relative Attractiveness
Mapfre stands out among peers due to its strong stock recovery (+almost 50% in 2025) and attractive valuation, with a PER below 10 compared to the sector average of 12. From a technical perspective, the stock trades at €3.78, consolidating above a key support zone at €3.63–3.70. A break above resistance at €3.80 could open a path toward the €4.00–4.05 zone, previous highs from 2018, while a drop below €3.65 would risk a correction toward €3.50. Key support levels are located around €3.63, the second support above the point of control (POC) at €3.396, and the third support at the lower end of the current accumulation area at €3.260. The RSI is currently highly overbought at 73.76%, and the MACD remains strongly bullish, supported by increasing histogram volume.
Strong claims performance, an improved combined ratio, and a ROE of 12.2% support the trend, while a dividend yield above 6% enhances its appeal for defensive investors.
Sector / Company Current PER Historical Avg. PER Premium (%) Performance 2025 YTD*
Mapfre 9,8x 9x 9% +48%
European Insurers 12x 9x 33% +14%
European Banks 9,8x 8,2x 19,5% +20%
Eurostoxx50 18x 16x 12,5% +8%
Stoxx600 15x 14x 7% +6%
*Performance as of August 2025. Ion Jauregui (2025)
Key Takeaways
• Mapfre stands out within the insurance sector, with a PER below the European average and a notable 48% gain year-to-date in 2025.
• This highlights that, despite the sector’s overall premium, Mapfre remains an attractive stock due to its growth potential and dividend.
• Comparing with EuroStoxx50, Stoxx600, and banks shows that the financial sector has led European market gains, though with significant differences between banks and insurers.
*******************************************************************************************
The information provided does not constitute investment research. The material has not been prepared in accordance with the legal requirements designed to promote the independence of investment research and such should be considered a marketing communication.
All information has been prepared by ActivTrades ("AT"). The information does not contain a record of AT's prices, or an offer of or solicitation for a transaction in any financial instrument. No representation or warranty is given as to the accuracy or completeness of this information.
Any material provided does not have regard to the specific investment objective and financial situation of any person who may receive it. Past performance and forecasting are not a synonym of a reliable indicator of future performance. AT provides an execution-only service. Consequently, any person acting on the information provided does so at their own risk. Political risk is unpredictable. Central bank actions can vary. Platform tools do not guarantee success.

Declinazione di responsabilità
Le informazioni e le pubblicazioni non sono intese come, e non costituiscono, consulenza o raccomandazioni finanziarie, di investimento, di trading o di altro tipo fornite o approvate da TradingView. Per ulteriori informazioni, consultare i Termini di utilizzo.
Declinazione di responsabilità
Le informazioni e le pubblicazioni non sono intese come, e non costituiscono, consulenza o raccomandazioni finanziarie, di investimento, di trading o di altro tipo fornite o approvate da TradingView. Per ulteriori informazioni, consultare i Termini di utilizzo.