$MATIC still trading mid-70s to mid-90s
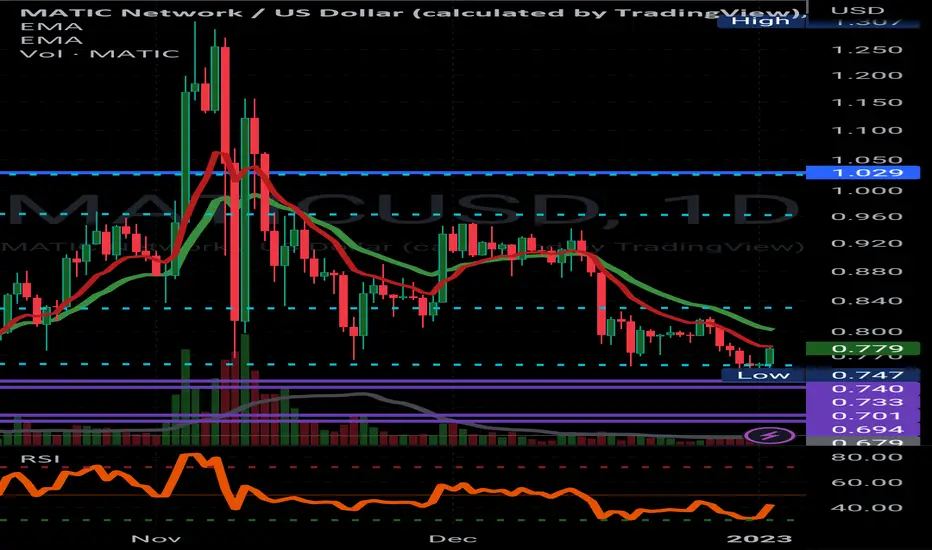
As the title states, matic has been trading between the mid 70s to the mid 90s. It had a brake lower one time and it had that huge pump a while ago above the '90s.
If you put MMATIC on a longer term time frame you will see why up move stopped.
Using daily is great for short-term pumps but if you use the longer-term charts, you'll see where the up swing will likely stop.
Once you see that the longer-term charts are no longer negative that's when you know we should keep pumping and daily charts will help you with resistance levels higher up and trading portions of them but this is when you begin to hodl. This is a process that takes a long time, especially if they are monthly charts.
If you put MMATIC on a longer term time frame you will see why up move stopped.
Using daily is great for short-term pumps but if you use the longer-term charts, you'll see where the up swing will likely stop.
Once you see that the longer-term charts are no longer negative that's when you know we should keep pumping and daily charts will help you with resistance levels higher up and trading portions of them but this is when you begin to hodl. This is a process that takes a long time, especially if they are monthly charts.

Declinazione di responsabilità
Le informazioni e le pubblicazioni non sono intese come, e non costituiscono, consulenza o raccomandazioni finanziarie, di investimento, di trading o di altro tipo fornite o approvate da TradingView. Per ulteriori informazioni, consultare i Termini di utilizzo.
Declinazione di responsabilità
Le informazioni e le pubblicazioni non sono intese come, e non costituiscono, consulenza o raccomandazioni finanziarie, di investimento, di trading o di altro tipo fornite o approvate da TradingView. Per ulteriori informazioni, consultare i Termini di utilizzo.