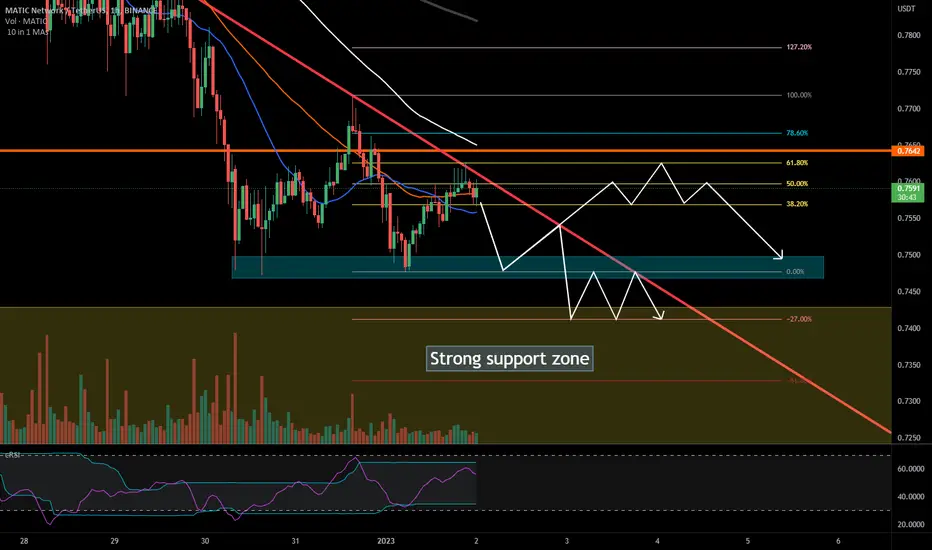
2 possible MATIC trajectories
$BINANCE:MATICUSDT
The price is near a very strong support zone . If the price bounces once again against the red trendline as shown on the chart, it is most likely to fall to the support zone drawn approximately to the -27% Fibonacci level. If the trendline is not respected and a strong bullish candle closes above the red trendline, it is most likely that the price will rise to the 61.8% Fibonacci level, coinciding approximately with a previous high.
The price is near a very strong support zone . If the price bounces once again against the red trendline as shown on the chart, it is most likely to fall to the support zone drawn approximately to the -27% Fibonacci level. If the trendline is not respected and a strong bullish candle closes above the red trendline, it is most likely that the price will rise to the 61.8% Fibonacci level, coinciding approximately with a previous high.

Declinazione di responsabilità
Le informazioni e le pubblicazioni non sono intese come, e non costituiscono, consulenza o raccomandazioni finanziarie, di investimento, di trading o di altro tipo fornite o approvate da TradingView. Per ulteriori informazioni, consultare i Termini di utilizzo.
Declinazione di responsabilità
Le informazioni e le pubblicazioni non sono intese come, e non costituiscono, consulenza o raccomandazioni finanziarie, di investimento, di trading o di altro tipo fornite o approvate da TradingView. Per ulteriori informazioni, consultare i Termini di utilizzo.