Long
#Matic 1W chart;
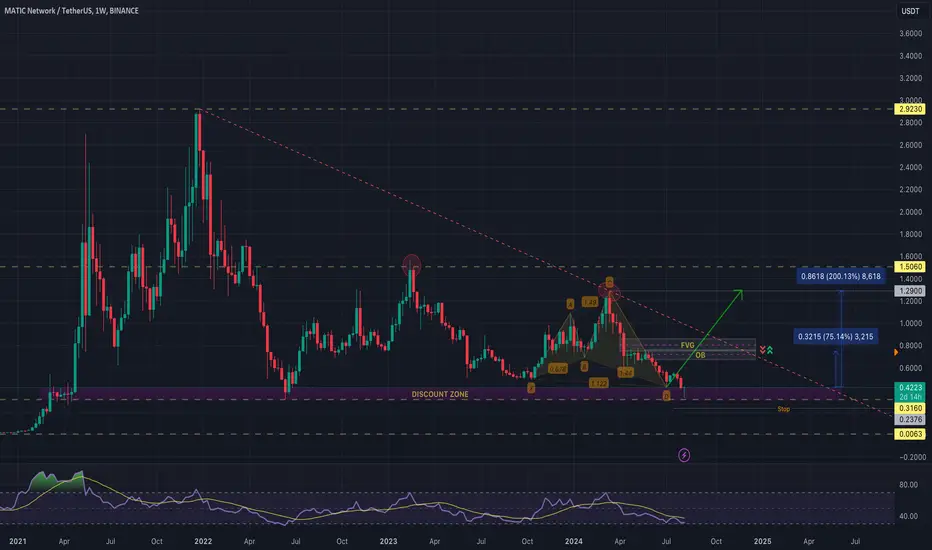
$CRYPTOCAP:MATIC 1W chart;
On the weekly chart, we can see that the balance of February 2023 and March 2024 levels on the RSI side is not reflected in the price (red circles).
It is now at a serious support level and it also seems to have started a bullish pattern from these levels.
As long as it sticks to the stop level, it will not be a surprise to see sharp upward rises after the squeeze between it and the downtrend line it will enter.
The ratio between the pattern target level is 200
However, we can consider OB-FVG regions as a profit-taking level beforehand.
On the weekly chart, we can see that the balance of February 2023 and March 2024 levels on the RSI side is not reflected in the price (red circles).
It is now at a serious support level and it also seems to have started a bullish pattern from these levels.
As long as it sticks to the stop level, it will not be a surprise to see sharp upward rises after the squeeze between it and the downtrend line it will enter.
The ratio between the pattern target level is 200
However, we can consider OB-FVG regions as a profit-taking level beforehand.

For more you can follow me on X. @UgurTash
Declinazione di responsabilità
Le informazioni e le pubblicazioni non sono intese come, e non costituiscono, consulenza o raccomandazioni finanziarie, di investimento, di trading o di altro tipo fornite o approvate da TradingView. Per ulteriori informazioni, consultare i Termini di utilizzo.
For more you can follow me on X. @UgurTash
Declinazione di responsabilità
Le informazioni e le pubblicazioni non sono intese come, e non costituiscono, consulenza o raccomandazioni finanziarie, di investimento, di trading o di altro tipo fornite o approvate da TradingView. Per ulteriori informazioni, consultare i Termini di utilizzo.