LDO vs MATIC 3day Chart
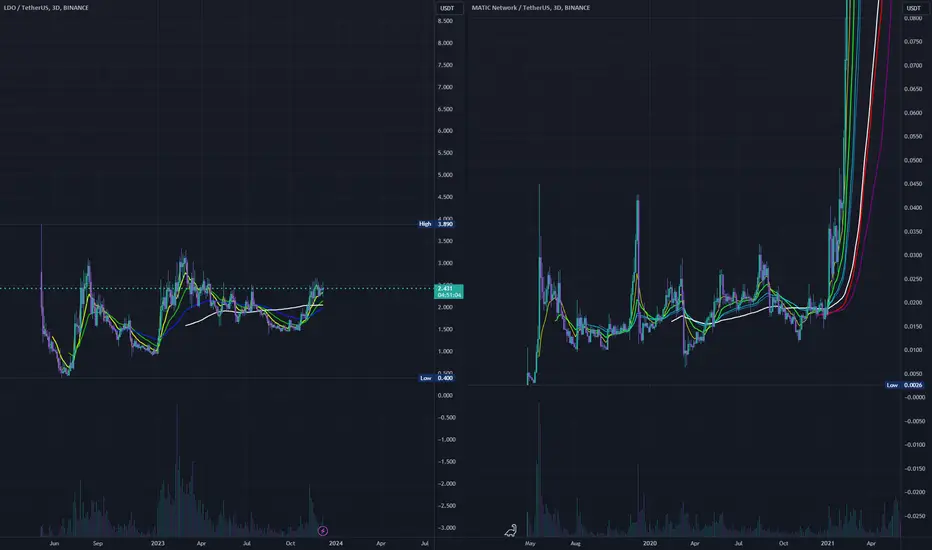
LDO and MATIC here, as you can see on MATIC, when 200MAs formed it went parabolic (14,000%)
History doesn't always repeat, but it does rhyme. LDO should moon eventually, maybe after BTC halving.
These moving averages will form in about 20 days. If they form under price, in theory, it should be bullish. Also, it is possible for price to get pulled into these newly formed moving averages and then spring off of them. Notice it happened on MATIC.
I don't want to miss the LDO train when it leaves the station. I will probably acc. from here and dip down into the 3day white 100 if we get that.
Thanks for your time. Please follow here for more!
History doesn't always repeat, but it does rhyme. LDO should moon eventually, maybe after BTC halving.
These moving averages will form in about 20 days. If they form under price, in theory, it should be bullish. Also, it is possible for price to get pulled into these newly formed moving averages and then spring off of them. Notice it happened on MATIC.
I don't want to miss the LDO train when it leaves the station. I will probably acc. from here and dip down into the 3day white 100 if we get that.
Thanks for your time. Please follow here for more!

Thanks for you time! Please like and follow!
Declinazione di responsabilità
Le informazioni e le pubblicazioni non sono intese come, e non costituiscono, consulenza o raccomandazioni finanziarie, di investimento, di trading o di altro tipo fornite o approvate da TradingView. Per ulteriori informazioni, consultare i Termini di utilizzo.
Thanks for you time! Please like and follow!
Declinazione di responsabilità
Le informazioni e le pubblicazioni non sono intese come, e non costituiscono, consulenza o raccomandazioni finanziarie, di investimento, di trading o di altro tipo fornite o approvate da TradingView. Per ulteriori informazioni, consultare i Termini di utilizzo.