
Overall Market Structure
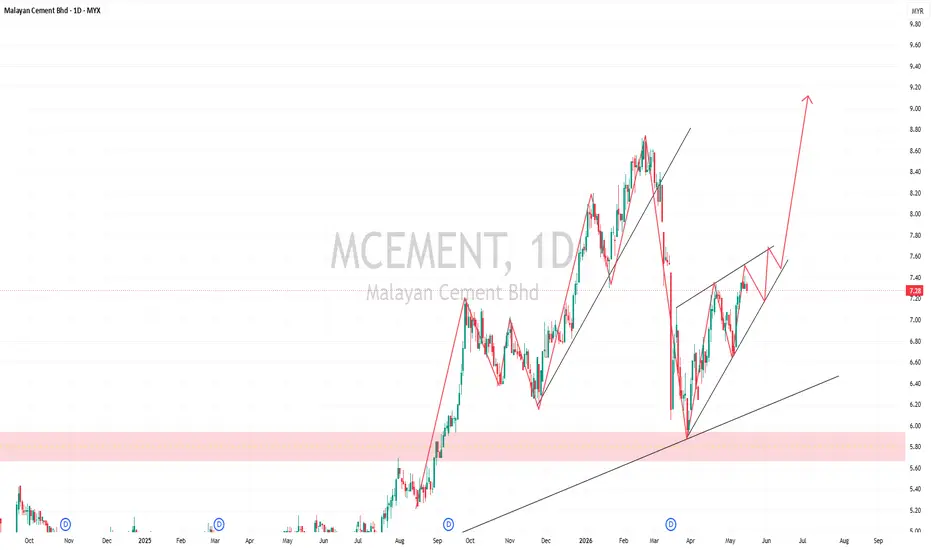
Based on the chart provided, MCEMENT remains in a medium-term bullish structure despite recent volatility. The stock has successfully rebounded from the major support zone around RM5.80–RM6.00 and is currently forming a higher low + ascending channel pattern.
The current setup suggests:
The market is attempting another bullish continuation wave.
Bullish Recovery Structure
The chart clearly shows:
Higher lows being formed
Recovery from strong support
Ascending price channel
Momentum stabilization after correction
This indicates:
Buyers are gradually regaining control.
If price respects the lower trendline support:
continuation toward RM7.60
then RM8.20–RM8.60 becomes increasingly possible.
Breakout Confirmation
A strong breakout above:
RM7.40–RM7.60
with volume expansion could trigger:
momentum buying
institutional participation
trend continuation
Potential upside targets:
RM8.20
RM8.60
RM9.00+
The projected structure on your chart suggests a possible acceleration phase if breakout confirmation occurs.Fundamental & Sector Narrative
MCEMENT benefits from several macro themes:
1. Infrastructure & Construction Cycle
Malaysia’s infrastructure spending remains supportive for:
cement demand
construction materials
industrial projects
Potential beneficiaries include:
highways
data centers
industrial parks
public infrastructure developments
2. Pricing Power Improvement
Cement players have recently shown:
stronger pricing discipline
improving margins
better cost management
If energy costs stabilize:
earnings recovery may strengthen further.
Risks & Threats
1. Resistance Zone Still Active
RM7.40–RM7.60 remains a critical resistance area.
Failure to break this zone may lead to:
sideways consolidation
short-term pullback
profit-taking pressure
2. Construction Sector Volatility
The stock remains sensitive to:
government project execution
economic slowdown
raw material cost fluctuations
diesel & energy prices
Any slowdown in infrastructure spending could affect sentiment.
3. Breakdown Risk
If price fails to hold:
RM7.00
then RM6.60
the bullish channel structure may weaken significantly.
Major downside support remains:
RM5.80–RM6.00
For Investors
MCEMENT appears suitable as:
a construction/infrastructure recovery play
medium-term cyclical exposure
trend-following setup
Current structure suggests:
accumulation may still be ongoing before the next expansion phase.
Conclusion
MCEMENT currently displays:
✅ Bullish recovery structure
✅ Ascending channel support
✅ Higher low formation
✅ Potential breakout setup
However, confirmation is still needed above RM7.60 before stronger upside momentum toward RM8.50–RM9.00 can develop.
At the current stage:
The stock remains in a constructive bullish setup, but still within a confirmation zone.
Based on the chart provided, MCEMENT remains in a medium-term bullish structure despite recent volatility. The stock has successfully rebounded from the major support zone around RM5.80–RM6.00 and is currently forming a higher low + ascending channel pattern.
The current setup suggests:
The market is attempting another bullish continuation wave.
Bullish Recovery Structure
The chart clearly shows:
Higher lows being formed
Recovery from strong support
Ascending price channel
Momentum stabilization after correction
This indicates:
Buyers are gradually regaining control.
If price respects the lower trendline support:
continuation toward RM7.60
then RM8.20–RM8.60 becomes increasingly possible.
Breakout Confirmation
A strong breakout above:
RM7.40–RM7.60
with volume expansion could trigger:
momentum buying
institutional participation
trend continuation
Potential upside targets:
RM8.20
RM8.60
RM9.00+
The projected structure on your chart suggests a possible acceleration phase if breakout confirmation occurs.Fundamental & Sector Narrative
MCEMENT benefits from several macro themes:
1. Infrastructure & Construction Cycle
Malaysia’s infrastructure spending remains supportive for:
cement demand
construction materials
industrial projects
Potential beneficiaries include:
highways
data centers
industrial parks
public infrastructure developments
2. Pricing Power Improvement
Cement players have recently shown:
stronger pricing discipline
improving margins
better cost management
If energy costs stabilize:
earnings recovery may strengthen further.
Risks & Threats
1. Resistance Zone Still Active
RM7.40–RM7.60 remains a critical resistance area.
Failure to break this zone may lead to:
sideways consolidation
short-term pullback
profit-taking pressure
2. Construction Sector Volatility
The stock remains sensitive to:
government project execution
economic slowdown
raw material cost fluctuations
diesel & energy prices
Any slowdown in infrastructure spending could affect sentiment.
3. Breakdown Risk
If price fails to hold:
RM7.00
then RM6.60
the bullish channel structure may weaken significantly.
Major downside support remains:
RM5.80–RM6.00
For Investors
MCEMENT appears suitable as:
a construction/infrastructure recovery play
medium-term cyclical exposure
trend-following setup
Current structure suggests:
accumulation may still be ongoing before the next expansion phase.
Conclusion
MCEMENT currently displays:
✅ Bullish recovery structure
✅ Ascending channel support
✅ Higher low formation
✅ Potential breakout setup
However, confirmation is still needed above RM7.60 before stronger upside momentum toward RM8.50–RM9.00 can develop.
At the current stage:
The stock remains in a constructive bullish setup, but still within a confirmation zone.

Declinazione di responsabilità
Le informazioni e le pubblicazioni non sono intese come, e non costituiscono, consulenza o raccomandazioni finanziarie, di investimento, di trading o di altro tipo fornite o approvate da TradingView. Per ulteriori informazioni, consultare i Termini di utilizzo.
Declinazione di responsabilità
Le informazioni e le pubblicazioni non sono intese come, e non costituiscono, consulenza o raccomandazioni finanziarie, di investimento, di trading o di altro tipo fornite o approvate da TradingView. Per ulteriori informazioni, consultare i Termini di utilizzo.