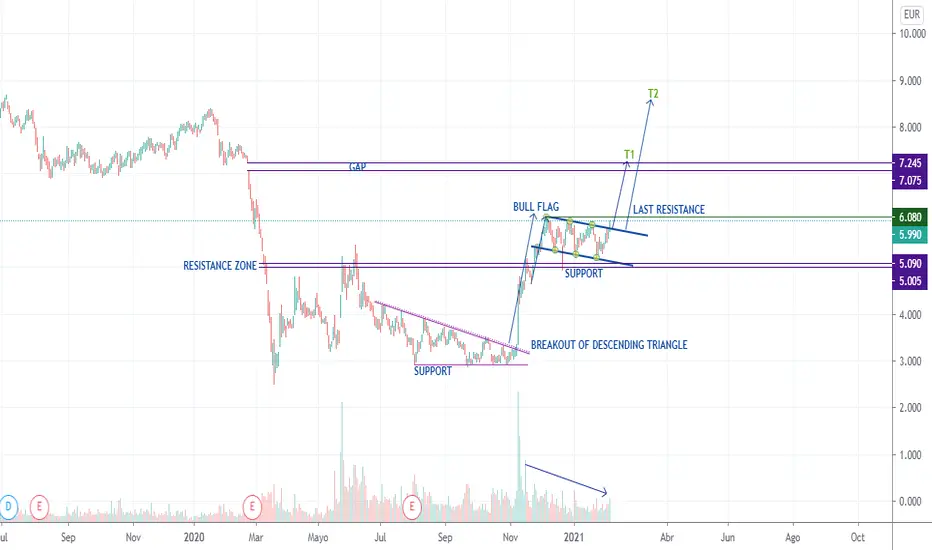
After a big advance shown by the price in November and December of 2020, the stock began to oscillate between two parallel lines with a negative slope forming a bull flag. Now, in recent days, the price has escaped form this flag and the first projection goes to 7.10 euros, which coincides with the gap of February 24, 2020.
During the formation of the flag we have:
Decreasing volume.
Fast and bullish previous trend.
A flag bounded by two parallel lines in the opposite direction to the previous trend.
 MEL
MEL
During the formation of the flag we have:
Decreasing volume.
Fast and bullish previous trend.
A flag bounded by two parallel lines in the opposite direction to the previous trend.
MEL
Declinazione di responsabilità
Le informazioni e le pubblicazioni non sono intese come, e non costituiscono, consulenza o raccomandazioni finanziarie, di investimento, di trading o di altro tipo fornite o approvate da TradingView. Per ulteriori informazioni, consultare i Termini di utilizzo.
Declinazione di responsabilità
Le informazioni e le pubblicazioni non sono intese come, e non costituiscono, consulenza o raccomandazioni finanziarie, di investimento, di trading o di altro tipo fornite o approvate da TradingView. Per ulteriori informazioni, consultare i Termini di utilizzo.