
Apoorv Dubey | SEBI Registered Research Analyst
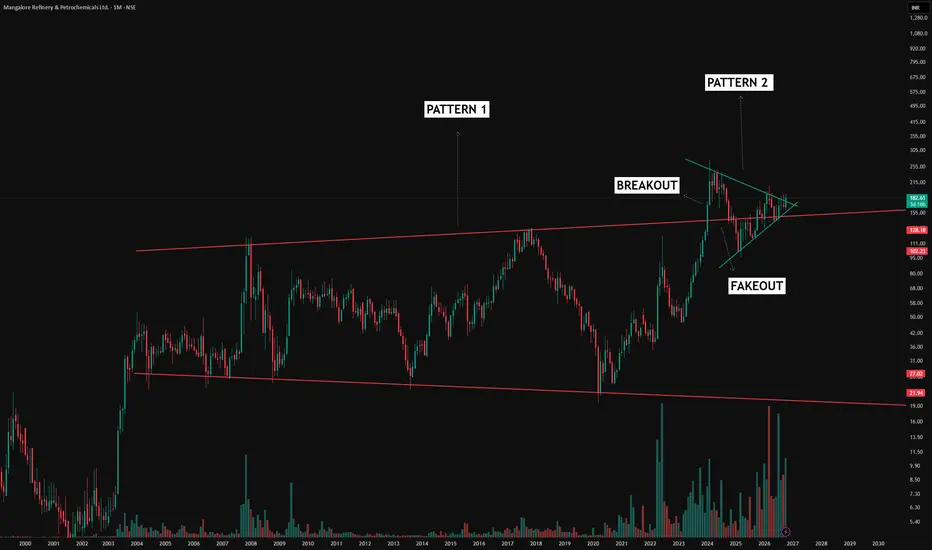
Consolidation does not always look like a neat horizontal range. MRPL’s monthly chart illustrates how it can change in shape, size and duration.
1. The larger structure — expanding swings
The red boundaries outline a multi-year broadening formation. Although price remained within a larger range, the movements inside it were substantial. A sideways market on a higher timeframe can still contain strong rallies and deep corrections.
2. The breakout and subsequent retracement
Price moved above the upper red boundary during the 2023–24 advance, then corrected back towards—and temporarily below—that boundary. This shows why the initial breakout alone does not tell the complete story.
3. A smaller pattern within the bigger picture
The green lines now outline a symmetrical triangle, with lower highs and higher lows compressing price around and above the former resistance area. The earlier expansion in price swings has given way to a tighter consolidation.
The learning: price can break a boundary, return through it, and develop a new structure around the same area. Consolidation can take different forms and last far longer than expected.
Study the sequence: broadening range → breakout → retracement → compression. Each stage adds context; none guarantees the next move.
The current monthly candle is still forming. The triangle’s eventual resolution and subsequent follow-through remain observations to assess.
For educational purposes only. This is not a recommendation to buy, sell or hold any security. Breakouts can fail, and chart patterns do not guarantee future outcomes.
Consolidation does not always look like a neat horizontal range. MRPL’s monthly chart illustrates how it can change in shape, size and duration.
1. The larger structure — expanding swings
The red boundaries outline a multi-year broadening formation. Although price remained within a larger range, the movements inside it were substantial. A sideways market on a higher timeframe can still contain strong rallies and deep corrections.
2. The breakout and subsequent retracement
Price moved above the upper red boundary during the 2023–24 advance, then corrected back towards—and temporarily below—that boundary. This shows why the initial breakout alone does not tell the complete story.
3. A smaller pattern within the bigger picture
The green lines now outline a symmetrical triangle, with lower highs and higher lows compressing price around and above the former resistance area. The earlier expansion in price swings has given way to a tighter consolidation.
The learning: price can break a boundary, return through it, and develop a new structure around the same area. Consolidation can take different forms and last far longer than expected.
Study the sequence: broadening range → breakout → retracement → compression. Each stage adds context; none guarantees the next move.
The current monthly candle is still forming. The triangle’s eventual resolution and subsequent follow-through remain observations to assess.
For educational purposes only. This is not a recommendation to buy, sell or hold any security. Breakouts can fail, and chart patterns do not guarantee future outcomes.

📊Swing & positional research with Buy, Sell & Hold recommendations
Contact for NOVEMBER SLOTS
📞WhatsApp ( Pro ): wa.me/919455664601
📢Free Picks on Telegram ( Join ) : t.me/hashtaghammer
Apoorv Dubey|SEBI RA INH000030287
Contact for NOVEMBER SLOTS
📞WhatsApp ( Pro ): wa.me/919455664601
📢Free Picks on Telegram ( Join ) : t.me/hashtaghammer
Apoorv Dubey|SEBI RA INH000030287
Pubblicazioni correlate
Declinazione di responsabilità
Le informazioni e le pubblicazioni non sono intese come, e non costituiscono, consulenza o raccomandazioni finanziarie, di investimento, di trading o di altro tipo fornite o approvate da TradingView. Per ulteriori informazioni, consultare i Termini di utilizzo.
📊Swing & positional research with Buy, Sell & Hold recommendations
Contact for NOVEMBER SLOTS
📞WhatsApp ( Pro ): wa.me/919455664601
📢Free Picks on Telegram ( Join ) : t.me/hashtaghammer
Apoorv Dubey|SEBI RA INH000030287
Contact for NOVEMBER SLOTS
📞WhatsApp ( Pro ): wa.me/919455664601
📢Free Picks on Telegram ( Join ) : t.me/hashtaghammer
Apoorv Dubey|SEBI RA INH000030287
Pubblicazioni correlate
Declinazione di responsabilità
Le informazioni e le pubblicazioni non sono intese come, e non costituiscono, consulenza o raccomandazioni finanziarie, di investimento, di trading o di altro tipo fornite o approvate da TradingView. Per ulteriori informazioni, consultare i Termini di utilizzo.