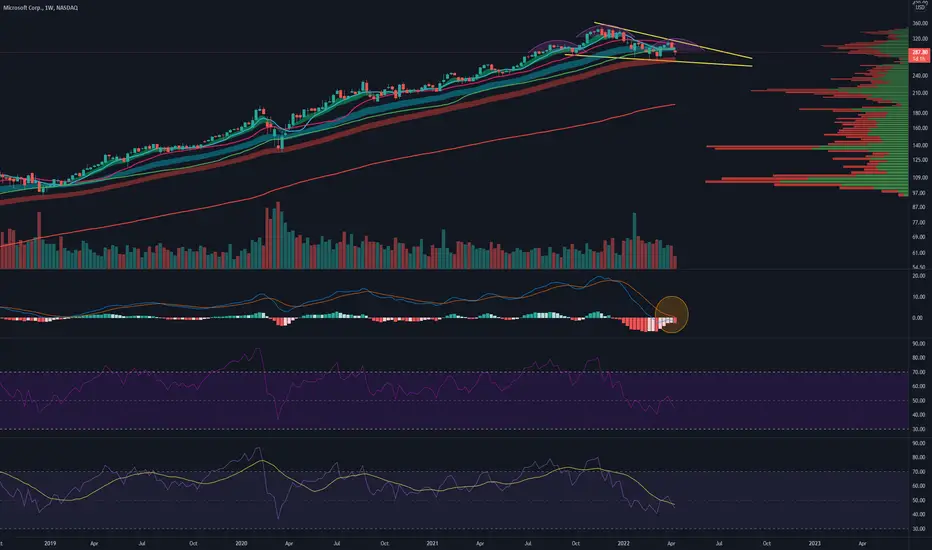
Bull Scenario = Falling wedge with a push off the 72/89 EMA cloud.
Bear Scenario = Inverted head and shoulders pattern with a failed bounce off the 72/89 EMA.
MACD may be stalling and curling. This is a weekly chart so a bit more macro.
 MSFT
MSFT
Bear Scenario = Inverted head and shoulders pattern with a failed bounce off the 72/89 EMA.
MACD may be stalling and curling. This is a weekly chart so a bit more macro.
MSFTNota
Looking more and more bearish. Testing that 72/89 EMA cloud. If it starts to really test that lower trend line of the wedge, I think that we're going to see the price fall. Given macro trends, I think the market is pricing this in now vs. the future when additional rate hikes happen.Nota
Once again testing the 72/89 EMA cloud further. Downside targets would be $233 and $213 if it falls out to the downside.
Declinazione di responsabilità
Le informazioni e le pubblicazioni non sono intese come, e non costituiscono, consulenza o raccomandazioni finanziarie, di investimento, di trading o di altro tipo fornite o approvate da TradingView. Per ulteriori informazioni, consultare i Termini di utilizzo.
Declinazione di responsabilità
Le informazioni e le pubblicazioni non sono intese come, e non costituiscono, consulenza o raccomandazioni finanziarie, di investimento, di trading o di altro tipo fornite o approvate da TradingView. Per ulteriori informazioni, consultare i Termini di utilizzo.