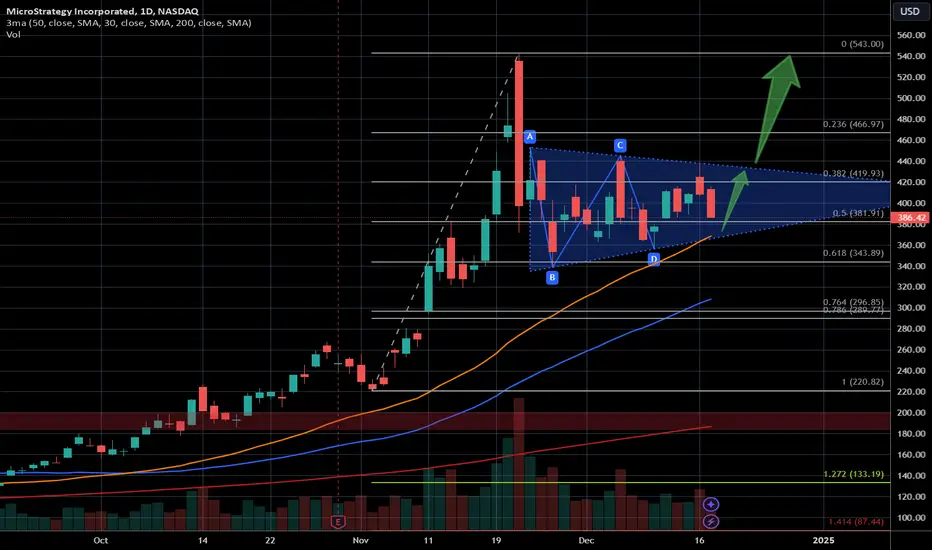
Here is the daily chart for $MSTR. With its recent inclusion in  QQQ, the stock appears poised for further growth.
From a technical perspective, the current triangle formation suggests potential downside movement toward $368, where the price may test the lower boundary of the pattern. Following this, I anticipate a bullish breakout to the upside.
The resistance near the previous all-time high (ATH) is unlikely to hold for long, and I expect MSTR to surpass this level in its upward trajectory.
QQQ, the stock appears poised for further growth.From a technical perspective, the current triangle formation suggests potential downside movement toward $368, where the price may test the lower boundary of the pattern. Following this, I anticipate a bullish breakout to the upside.
The resistance near the previous all-time high (ATH) is unlikely to hold for long, and I expect
MSTR to surpass this level in its upward trajectory.Trade attivo
The triangle completely failed (haters put shame on me ;) ), but I'm staying bullish for now. The line chart is offering a bullish flag like this:Let's see if it plays out. Price should stabilize by the 23rd of Dec because all ETFs got to buy by this date. Maybe we see tomorrow already a bullish day. Let's see.

Declinazione di responsabilità
Le informazioni e le pubblicazioni non sono intese come, e non costituiscono, consulenza o raccomandazioni finanziarie, di investimento, di trading o di altro tipo fornite o approvate da TradingView. Per ulteriori informazioni, consultare i Termini di utilizzo.
Declinazione di responsabilità
Le informazioni e le pubblicazioni non sono intese come, e non costituiscono, consulenza o raccomandazioni finanziarie, di investimento, di trading o di altro tipo fornite o approvate da TradingView. Per ulteriori informazioni, consultare i Termini di utilizzo.