Why Micron’s 26,000% Legacy is Just the Beginning
To learn how to operate in the stock market it is interesting to stop thinking about money for a while and start understanding what is actually happening.
Today I bring you an example with MU a company that in less than 20 years has offered a 26,000% return and is now a global benchmark.
However this has not always been the case and certain events have determined market movements for months and years. Learning from these movements helps you better capture the long term essence of the market what is valued and what is not. Understanding that suffering is temporary if the company knows how to reverse it and that these drops can offer wonderful opportunities.
1️⃣ Micron did not start as a multinational. In fact it was 4 people with a consulting vocation in the 70s but they quickly pivoted to manufacturing DRAM the short term memory of a computer and became famous for being the scrappy low cost leader. While many American chipmakers quit when faced with fierce Japanese competition in the 80s Micron survived by being leaner and more efficient than anyone else.
2️⃣ From the year 2000 Micron was a slave to PC cycles. As seen in the 2000 Dot Com crash and the 2015 price wars if people stopped buying computers Micron’s profits vanished . But they transformed the company. During these winters Micron played a game of Last Man Standing. When competitors like Qimonda in 2009 went bankrupt Micron did not just survive they expanded. By acquiring rivals like Elpida in 2013 they helped turn a crowded chaotic market into a stable Oligopoly dominated by just three players Samsung SK Hynix and Micron.
3️⃣ Recently Micron has made one more masterstroke. It has no longer just achieved being part of a commodity oligopoly. They are now the architects of HBM or High Bandwidth Memory. Think of HBM as a super highway for data. This is CRUCIAL since AI chips like those from Nvidia are incredibly fast but they need memory that can keep up. Micron’s transformation into a specialized AI partner means they now command higher prices and stronger loyalty than ever before.
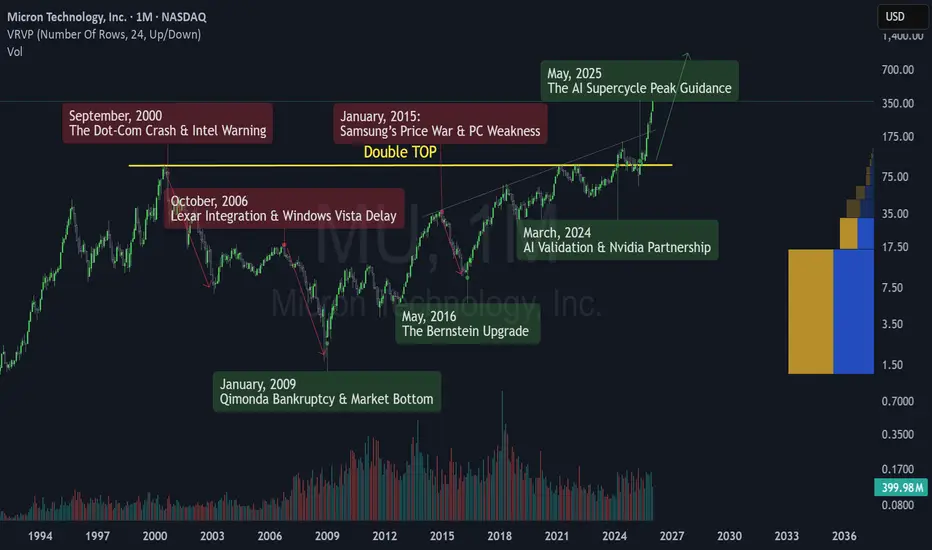
On the other hand I leave you a chronology of the most outstanding fundamental events and how they fit with the chart and the trend change points.
Key Historical Market Movers
🔴 September 21 2000 -> The Dot Com Crash and Intel Warning Intel issued a massive profit warning due to weak PC demand in Europe triggering a sector wide collapse. Micron’s stock plummeted as the era of irrational exuberance for hardware components came to a violent end.
🔴 October 4 2006 -> Lexar Integration and Windows Vista Delay Micron reported disappointing quarterly margins following the acquisition of Lexar Media. The market reacted negatively to the integration costs and the delayed launch of Windows Vista which stalled the expected PC refresh cycle.
🟢 January 23 2009 -> Qimonda Bankruptcy and Market Bottom German rival Qimonda filed for insolvency significantly reducing the global supply of DRAM. This event created a long term price floor for the industry and marked the start of a massive recovery for surviving players like Micron.
🔴 January 7 2015 -> Samsung’s Price War and PC Weakness Concerns peaked as Samsung signaled aggressive capacity expansion despite slowing PC sales. Investors fled Micron fearing a return to the race to the bottom in memory pricing leading to a sharp double digit decline.
🟢 May 23 2016 -> The Bernstein Upgrade, analysts at Bernstein upgraded the stock spotting a fundamental shift toward supply discipline among the big three. This call accurately predicted the end of the memory winter and the start of a multi year bull run.
🟢 March 20 2024 -> AI Validation and Nvidia Partnership Micron reported a surprise profit and confirmed that its high bandwidth memory HBM3E was sold out for the year. This solidified the company’s role as a critical pillar in the AI infrastructure alongside Nvidia.
🟢 May 22 2025 -> The AI Supercycle Peak Guidance Capitalizing on the insatiable demand for AI servers Micron issued record breaking guidance for the second half of the year. This news triggered a massive rally as the stock broke through major psychological resistance levels.
🧑💻 Taking advantage
This transformation can make MU prices go to levels never before seen or imagined but we also have the support of the charts.
Recently we have broken a Double Top to the upside and this usually implies very very significant increases in the long term.
It seems thatMU can easily exceed 1,000 dollars in the coming years as it has such important technology for the new era of AI. I will not go into the technical part but almost 75 percent of cases of a double top breakout send the price to the equivalent of a 700 percent rally from the breakout of this double top.
That is why it is vital to be attentive to chart patterns to catch these types of operations where the fundamental and technical parts match perfectly. Furthermore knowing this about the long term it is very easy to find bullish entries in the short term and take advantage of the small rallies that arise within a rally of so many years like this one for MU.
👇 WANT MORE?
Hit the rocket, read my profile or follow so we can find each other again.
To learn how to operate in the stock market it is interesting to stop thinking about money for a while and start understanding what is actually happening.
Today I bring you an example with
MU a company that in less than 20 years has offered a 26,000% return and is now a global benchmark. However this has not always been the case and certain events have determined market movements for months and years. Learning from these movements helps you better capture the long term essence of the market what is valued and what is not. Understanding that suffering is temporary if the company knows how to reverse it and that these drops can offer wonderful opportunities.
1️⃣ Micron did not start as a multinational. In fact it was 4 people with a consulting vocation in the 70s but they quickly pivoted to manufacturing DRAM the short term memory of a computer and became famous for being the scrappy low cost leader. While many American chipmakers quit when faced with fierce Japanese competition in the 80s Micron survived by being leaner and more efficient than anyone else.
2️⃣ From the year 2000 Micron was a slave to PC cycles. As seen in the 2000 Dot Com crash and the 2015 price wars if people stopped buying computers Micron’s profits vanished . But they transformed the company. During these winters Micron played a game of Last Man Standing. When competitors like Qimonda in 2009 went bankrupt Micron did not just survive they expanded. By acquiring rivals like Elpida in 2013 they helped turn a crowded chaotic market into a stable Oligopoly dominated by just three players Samsung SK Hynix and Micron.
3️⃣ Recently Micron has made one more masterstroke. It has no longer just achieved being part of a commodity oligopoly. They are now the architects of HBM or High Bandwidth Memory. Think of HBM as a super highway for data. This is CRUCIAL since AI chips like those from Nvidia are incredibly fast but they need memory that can keep up. Micron’s transformation into a specialized AI partner means they now command higher prices and stronger loyalty than ever before.
On the other hand I leave you a chronology of the most outstanding fundamental events and how they fit with the chart and the trend change points.
Key Historical Market Movers
🔴 September 21 2000 -> The Dot Com Crash and Intel Warning Intel issued a massive profit warning due to weak PC demand in Europe triggering a sector wide collapse. Micron’s stock plummeted as the era of irrational exuberance for hardware components came to a violent end.
🔴 October 4 2006 -> Lexar Integration and Windows Vista Delay Micron reported disappointing quarterly margins following the acquisition of Lexar Media. The market reacted negatively to the integration costs and the delayed launch of Windows Vista which stalled the expected PC refresh cycle.
🟢 January 23 2009 -> Qimonda Bankruptcy and Market Bottom German rival Qimonda filed for insolvency significantly reducing the global supply of DRAM. This event created a long term price floor for the industry and marked the start of a massive recovery for surviving players like Micron.
🔴 January 7 2015 -> Samsung’s Price War and PC Weakness Concerns peaked as Samsung signaled aggressive capacity expansion despite slowing PC sales. Investors fled Micron fearing a return to the race to the bottom in memory pricing leading to a sharp double digit decline.
🟢 May 23 2016 -> The Bernstein Upgrade, analysts at Bernstein upgraded the stock spotting a fundamental shift toward supply discipline among the big three. This call accurately predicted the end of the memory winter and the start of a multi year bull run.
🟢 March 20 2024 -> AI Validation and Nvidia Partnership Micron reported a surprise profit and confirmed that its high bandwidth memory HBM3E was sold out for the year. This solidified the company’s role as a critical pillar in the AI infrastructure alongside Nvidia.
🟢 May 22 2025 -> The AI Supercycle Peak Guidance Capitalizing on the insatiable demand for AI servers Micron issued record breaking guidance for the second half of the year. This news triggered a massive rally as the stock broke through major psychological resistance levels.
🧑💻 Taking advantage
This transformation can make MU prices go to levels never before seen or imagined but we also have the support of the charts.
Recently we have broken a Double Top to the upside and this usually implies very very significant increases in the long term.
It seems that
MU can easily exceed 1,000 dollars in the coming years as it has such important technology for the new era of AI. I will not go into the technical part but almost 75 percent of cases of a double top breakout send the price to the equivalent of a 700 percent rally from the breakout of this double top. That is why it is vital to be attentive to chart patterns to catch these types of operations where the fundamental and technical parts match perfectly. Furthermore knowing this about the long term it is very easy to find bullish entries in the short term and take advantage of the small rallies that arise within a rally of so many years like this one for MU.
👇 WANT MORE?
Hit the rocket, read my profile or follow so we can find each other again.

🚀 Simple Chart Patterns. Serious Profits.
📈 +200% returns
🎯 70%+ win rate (audited)
Trade smarter, not harder.
👉topchartpatterns.substack.com/subscribe
📩 Business: info@topchartpatterns.com
📈 +200% returns
🎯 70%+ win rate (audited)
Trade smarter, not harder.
👉topchartpatterns.substack.com/subscribe
📩 Business: info@topchartpatterns.com
Pubblicazioni correlate
Declinazione di responsabilità
Le informazioni e le pubblicazioni non sono intese come, e non costituiscono, consulenza o raccomandazioni finanziarie, di investimento, di trading o di altro tipo fornite o approvate da TradingView. Per ulteriori informazioni, consultare i Termini di utilizzo.
🚀 Simple Chart Patterns. Serious Profits.
📈 +200% returns
🎯 70%+ win rate (audited)
Trade smarter, not harder.
👉topchartpatterns.substack.com/subscribe
📩 Business: info@topchartpatterns.com
📈 +200% returns
🎯 70%+ win rate (audited)
Trade smarter, not harder.
👉topchartpatterns.substack.com/subscribe
📩 Business: info@topchartpatterns.com
Pubblicazioni correlate
Declinazione di responsabilità
Le informazioni e le pubblicazioni non sono intese come, e non costituiscono, consulenza o raccomandazioni finanziarie, di investimento, di trading o di altro tipo fornite o approvate da TradingView. Per ulteriori informazioni, consultare i Termini di utilizzo.